
Harness Hadoop and Spark for user-friendly BI
Big data shouldn’t be an area for only academics, data scientists, and other specialists. In fact, it can’t be. If we want big data to benefit industry at large, it needs to be accessible by mainstream information workers. Big data technology must fit into the workflows, habits, skill sets, and requirements of business users across enterprises.
Datameer is a big data analytics application doing exactly that. Combining the user interface metaphors of a file browser and a spreadsheet, Datameer runs natively on open source big data technologies like Hadoop and Spark, while hiding their complexity and facilitating their use in enterprise IT environments and business user scenarios.
In other words, Datameer creates an abstraction layer over open source big data technologies that integrates them into the stable of platforms and toolchains in use in enterprise business environments. Business users tap the power of big data analytics through a familiar spreadsheet workbook and formula interface, while also benefiting from enterprise-grade management, security, and governance controls.
Before we dive into the details of the platform, we should note that Datameer supports the full data lifecycle, including data acquisition and import (sometimes referred to as “ingest”), data preparation, analysis, and visualization, as well as export to other systems, such as databases, file stores, and even other BI tools.
Data import is achieved with more than 70 connectors to databases, file formats, and applications, providing diversified connectivity for structured, semistructured, and unstructured data. Nevertheless, once a given set of data is in Datameer, it can migrate through all of the data lifecycle stages mentioned previously, right along with data from other sources.
System architecture
At the heart of Datameer is the core server referred to internally as the conductor. The conductor orchestrates all work and manages the configuration of all jobs performed on the Hadoop cluster. It lets users interact with the underlying data sources via Datameer’s user interface, and it lets tools interact with the data via its API.
The conductor also has a special interactive mode that accommodates the user’s incidental work in the spreadsheet user interface. This interactivity is facilitated by Datameer’s Smart Sampling technology, which allows the user to work with a manageable and representative subset of the data in memory. When the design work is done, the workbook is executed against the full data set via a job submitted to the cluster.
This fluid movement between interactive design work by the user and bulk execution by the Conductor (running on the Hadoop cluster) is the key to Datameer’s harmonization of open source big data and enterprise BI sensibilities and workflows.
Although Datameer works cooperatively with a Hadoop cluster, the application itself executes on a standalone server (“edge node”) or desktop PC running Windows, Linux, Unix, or MacOS. It is compatible with modern browsers, including Safari and Chrome, as well as Microsoft’s Internet Explorer 11 and the new Edge browser in Windows 10.
Security and governance
From the very early days of the Datameer product – when Hadoop itself offered only file-level security – Datameer provided for role-based access controls on specific subsets of data, a non-negotiable requirement for most enterprises.
By sharing data through multiple workbooks, each of which may contain a different subset of data, and assigning permissions on each workbook to unique security groups, Datameer provides for the row-level security that enterprises need. Column-level security is accommodated as well, either through inclusion of select columns in a group-specific workbook or via masking of data in particular columns, for particular security groups.
While Datameer allows users, roles, and groups to be created and maintained, it can also integrate with Microsoft Active Directory or other LDAP user stores, authenticating users against, and assigning permissions to, the groups that are defined in those systems. Datameer can also integrate with enterprise single-sign-on (SSO) systems.
As a web application, Datameer can be run over SSL or HTTPS connections, thus providing encryption of actions and data between user and application.
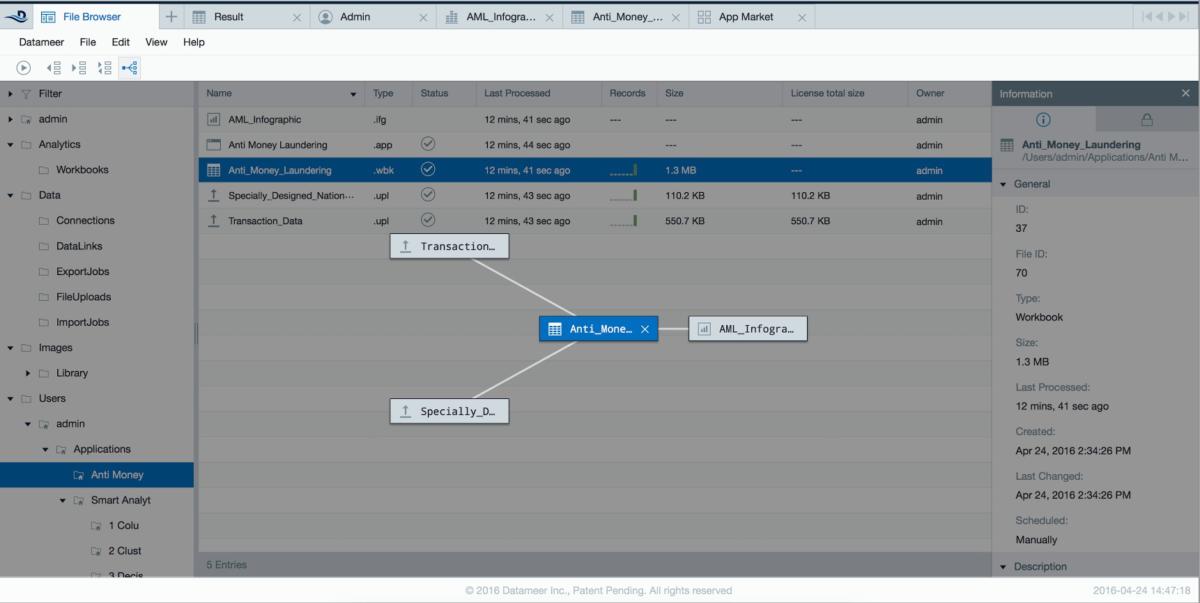
Datameer provides full data lineage information, rendered in diagrammatic or columnar views (see figure below), so data can be tracked from import job to workbooks to individual chart widgets in business infographic data visualizations.
 Datameer
For audit control, Datameer supports an “event bus” listener-based API, wherein all user interface and data entity events (creation of workbooks, addition of users to groups, assigning or revoking of permissions) are described on an emergent basis to all API subscribers.
This event bus facilitates integration with external governance systems that may be in use at particular customer sites. For more standalone audit management, Datameer records these events in its own log files, which can in turn be imported into Datameer itself, then analyzed and visualized there.
Data integration architecture
Because Datameer is designed to work natively with big data technology, even its data import and export functionality is run on the cluster. This allows for limitless horizontal scaling to facilitate data processing at very high volume. It’s an approach that sets Datameer apart from many of its competitors.
Nonetheless, for smaller data sets, Datameer does provide file upload jobs and the ability to download the content of any sheet in a workbook on an ad hoc basis (in the form of a simple file).
Datameer accommodates workflows where the source data set remains in its home repository (database, file, and so on) and is queried only for Smart Sampling purposes and during workbook execution. These “data links” assure that data movement and duplication are minimized while still allowing for interactive work against the data source, and cluster-based processing against the full data set when the workbook is executed.
Data preparation, analytics, and visualization
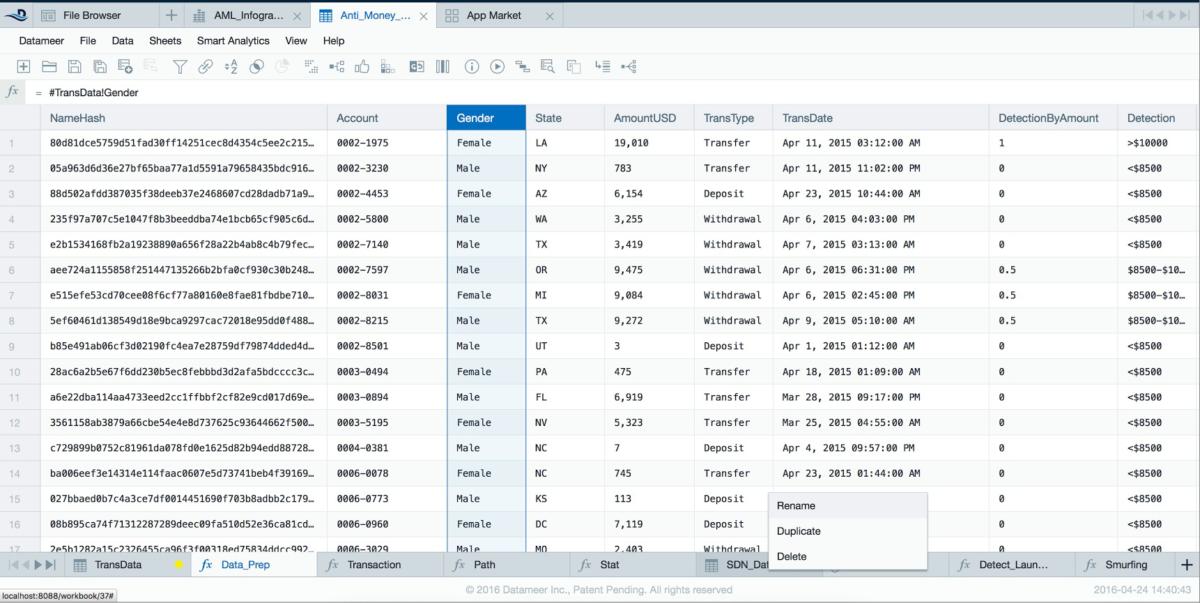
The key to Datameer’s “aesthetic” is the use of successive columns in a sheet, and successive sheets in a workbook, to yield a gradual (and self-documenting) evolution of source data sets into the analyzed whole.
This approach combines the tasks of data preparation and analysis in a single environment, by providing a library of more than 270 spreadsheet formula functions that serve each purpose (and sometimes both purposes). An example of the Datameer workbook is shown below.
 Datameer
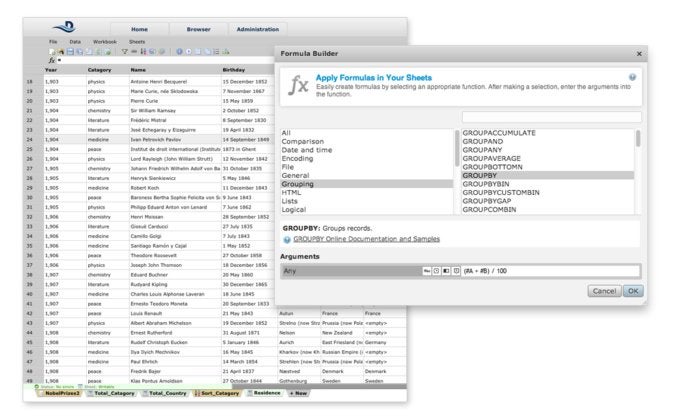
Formula functions run the gamut from mundane standbys like functions for manipulating text, formatting numbers, and doing simple arithmetic to functions that group data in specific ways for aggregational analysis to specialized functions for parsing file names, HTML content, and XML- and JSON-formatted data. You’ll even find functions that can mine text for organization names and parts of speech and provide sentiment analysis on individual words.
Formulas can be entered in a formula bar or built with the assistance of the Formula Builder dialog (below), which allows pointing-and-clicking on individual columns in particular sheets to supply their data as formula parameter values.
 Datameer
Each sheet in a workbook serves as a view on the data set because workbooks don’t alter the original data. Sheets have a cascading relationship where, for example, data from sheet A is used and transformed by sheet B, which is further used and transformed by sheet C. In this way, every transformation and analysis step is made transparent and easily discoverable.
What’s more, each sheet in a workbook can have its data profiled at any time by switching to that sheet’s Flipside view, which provides histogram visualizations for each column. Along with the histogram, Flipside shows the distribution of values the column contains, the data type, the total number of values and distinct values in the column, and the minimum, maximum, and average value for all data within it.
Moving between different workbooks, the file browser, and various business infographics is made easy by Datameer’s context tabs, which allow the user to shift fluidly between the different views and return to each, in context, whenever that may be called for.
Context tabs, when combined with Datameer’s full data lifecycle functionality, perfectly facilitate working on data from multiple angles at once, rather than being forced into a linear, assembly-line approach of doing preparation, analysis, and visualization in a particular order. Many people prefer to work on each phase in a piecemeal fashion, bringing it all together at the end. Datameer fully supports that scenario.
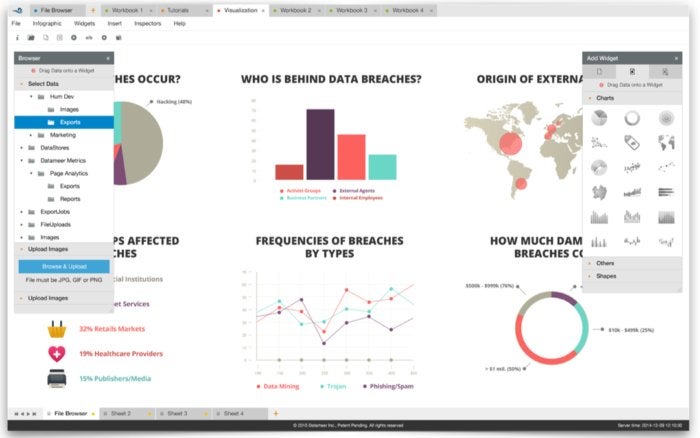
Built using the latest HTML5 technologies, Datameer’s Infographic Designer (below) supports the creation and viewing of informative visualizations from any browser on a multitude of devices. The pixel-perfect design interface allows users to combine chart widgets with text annotations, images, videos, and other elements. Infographics are composed from more than 20 fully customizable drag-and-drop chart widgets, each based on the popular D3 visualization standard. The Infographic Designer can create high-end dashboards, operational reports, and beautiful, customized, special-purpose infographics.
 Datameer
Smart Analytics
Datameer’s Smart Analytics technology provides four major algorithms that make it even easier to find the signal in the noise of big data: clustering, decision trees, column dependencies, and recommendations.
Models based on these algorithms manifest the same way other analytical assets within Datameer do: as sheets in a workbook. The sheets show all model data, along with predicted values, and the Flipside view will render a graphical representation of the model and its content.
By incorporating machine learning functionality in-situ, within the workbook user experience, Datameer provides machine learning capabilities without forcing users to have vastly specialized skills or endure abrupt user interface context switches.
This integration is further extended through the use of an optional Predictive Model Markup Language (PMML) plugin, provided by our partner, Zementis. The plugin allows scoring against machine learning models built in other tools (and published in PMML format) by exposing them within Datameer as additional spreadsheet functions.
A patent-pending execution framework
Datameer simplifies selection of execution frameworks through its patent-pending Smart Execution engine, which picks the best framework for users along each step in the analytics workflow. It takes full advantage of Apache Tez, Apache Spark, and Datameer’s own single-node, in-memory engine, freeing users from having to evaluate the best engine for any given analytics job or task.
Smart Execution provides a future-proof approach to big data analytics. By decoupling the design experience from processing on a particular execution engine, Datameer permits workbooks developed today to be functional against new execution frameworks tomorrow, as they emerge and take their place in the Smart Execution platform.
While open source big data technologies hold the keys to answering new business questions, they weren’t designed with business users in mind. Combining a spreadsheet workbook and formula interface with a cost-based query optimizer that picks the right engine for a particular set of tasks, Datameer turns Hadoop, Spark, and company into user-friendly BI tools for the business at large.
Datameer makes the big data aspiration a reality by harnessing the power of these platforms and working with them in their native capacities, not merely treating them as relational databases. At the same time, Datameer embeds these open source technologies into a business-user-oriented application, premised on familiar spreadsheet constructs, for working with data across its lifecycle and extracting relevant information from it.
New Tech Forum provides a venue to explore and discuss emerging enterprise technology in unprecedented depth and breadth. The selection is subjective, based on our pick of the technologies we believe to be important and of greatest interest to InfoWorld readers. InfoWorld does not accept marketing collateral for publication and reserves the right to edit all contributed content. Send all inquiries to newtechforum@infoworld.com.
Source: InfoWorld Big Data