How Arcadia Data brings self-service BI to the data lake

How Arcadia Data brings self-service BI to the data lake

Data has evolved over the years. Complex data structures, unstructured data, real-time processing, growing data volumes, and new varieties of data are all part of the evolution. Platforms have changed as well. “Schema-less,” real-time events, “schema-on-read,” and extract/load/discover/transform (ELDT) are now part of our vernacular.

Despite these changes, many businesses rely on the same data warehouse infrastructure that they’ve relied on for years. Many businesses have also turned to data lakes, through platforms such as Apache Hadoop, NoSQL databases, and Apache Kafka, or cloud storage technologies like Amazon S3, as a cost-effective way of managing large volumes of disparate data sets. Unfortunately, the success rates of these data lakes have been disappointing, as they have not been able to deliver quicker or better value to businesses.

Why isn’t the data lake living up to its promise? It turns out that the data lake architecture is a robust data management strategy, but a weak data intelligence strategy, due to its lack of focus on tools to analyze the data. While the data landscape has evolved, not all tools have kept pace. The data management platforms have changed, and it’s time to rethink the BI and analytics tools as well.

In this article, we’ll examine the advantages of an analytics and BI platform built specifically for data lakes, and how Arcadia Enterprise, the flagship product from Arcadia Data, brings self-service analytics to those environments. 

BI and the data lake

A common practice to enable BI on data lakes is to use traditional tools designed for data warehouses and layer them on the data lake. However, because the data in the data lakes is both large in scale and fast moving, what was inefficient but tolerable in the data warehouse has become impractical and even painful in the data lake. Data movement to BI-specific servers, heavy data performance modeling into cubes and extracts, and slow feedback loops between IT and business analysts have all become barriers to insight. BI tools designed for the data warehouse have limited the value of the data lake.

Instead of constraining the value of your data lake, you should embrace a new approach to BI: Keep your existing BI tools for your remaining data warehouse workloads, but use “native” BI tools, i.e., tools that were architected for data lakes, for your modern data platform. These tools are deemed “native” because they run within the data lake cluster—the BI engine is distributed and runs on each data node. Analytics are performed where the data lives, and data movement to a separate BI-specific cluster is eliminated. In addition, the benefits of a native BI platform include unified security, seamless semantic modeling, and query processing optimizations that result in reduced administration, improved self-service, and high speed and scalability.

arcadia enterprise dashboardArcadia Data

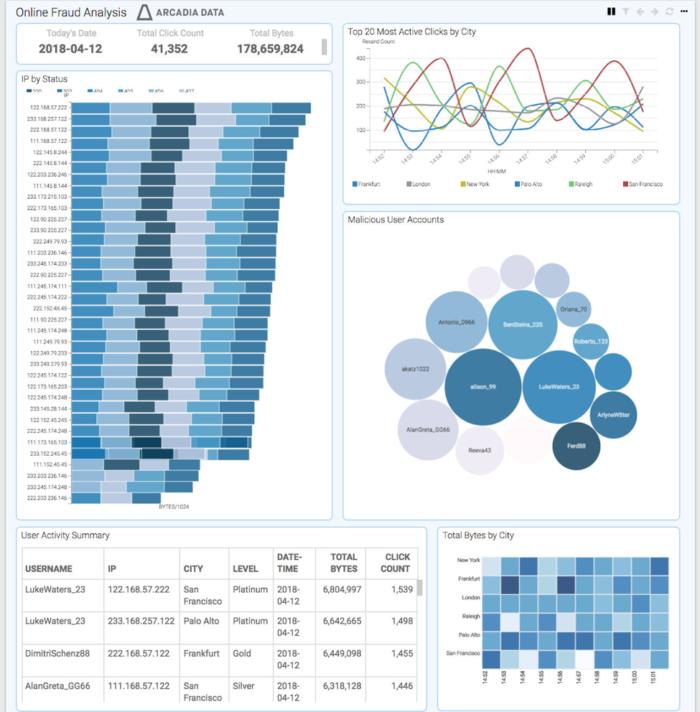
Arcadia Enterprise provides an analytics/BI platform native to big data.

Semantic modeling for self-service BI

If faster time-to-insight on large and diverse data sets is what you hope to achieve from your data lake, then using the right tools will be a key factor in achieving that objective. One key inhibitor to self-service analytics with traditional BI tools is the slow process of moving data from the data lake to the dedicated BI server for analysis. This process has the additional drawback of separating the semantic modeling and analytic/visual discovery steps, resulting in long, drawn-out feedback loops. Arcadia Enterprise shortens the analytics lifecycle by keeping data in the data lake, allowing you to do data discovery and semantic modeling in tighter feedback loops without any IT intervention.

Business analysts need a business-oriented view of the data that they can easily explore and analyze. This “business meaning” needs to be documented alongside the data tables and fields of their database. In Arcadia Enterprise, this information is stored as a “dataset,” a semantic layer that provides a business-facing definition to the underlying data.

The semantic layer is critical for helping non-technical users understand the data. In many traditional analytics environments, semantic layers are created and maintained by IT personnel. This is not an ideal situation, because IT personnel often do not have the same view of data as the analysts. They tend to use different terms, often do not understand the business definition of the data, and often do not know what queries would be run by end users. IT personnel typically need frequent interactions with business analysts to properly define the data.

Arcadia Enterprise provides an easy-to-use interface to let business analysts create and maintain an accurate and detailed semantic layer. Semantic layers can be used to enable the right level of information sharing and collaboration across authorized users. Two key features come into play here:

  • Data model definition. Power users or analysts can specify tables (and fields) to join and the join type (e.g., inner, left, right). Users can preview a subset of the joined data.
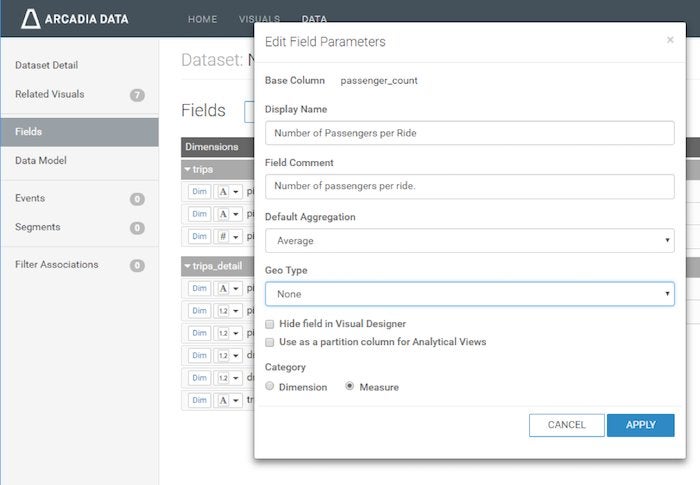
  • Field definitions. For enriching information about fields, users can set a display name, add a comment/description, specify a default aggregation (used in the visualization interface), and specify geo type (see screen image below). Users can also categorize fields as a “dimension” or a “measure,” set the data type, and hide fields from the visualization interface.

arcadia enterprise semantic layer uiArcadia Data

The Arcadia Enterprise semantic layer UI lets users add meaning to data tables.

Arcadia Enterprise initially makes a best guess about field definitions, which can then be updated as desired. As part of a comprehensive self-service analytics platform, the Arcadia Enterprise semantic layer interface simplifies the access to data for non-technical users. Users do not have to turn to IT personnel to define these layers, but are empowered to make adjustments at will and quickly build visualizations, dashboards, and analytical applications.

Accelerating queries with analytical views

Another factor in shorter analytics lifecycles is of course query performance. Here Arcadia Data leverages a technology we call Smart Acceleration, which is a built-in recommendation engine that analyzes queries and defines pre-computed aggregates to speed up application queries with minimal IT effort. These pre-computed aggregates are known as analytical views.

Arcadia Enterprise analytical views are a semantic caching mechanism that allows you to pre-compute and cache the results of expensive SQL operations, such as grouping and aggregation. Query acceleration on data lakes is an increasingly popular topic, especially with new business requirements around high volumes of data and high levels of concurrent users. Businesses are finding that without query acceleration, they can’t fully address the analytical demands of their end users.

But even with query acceleration, using traditional approaches like moving data to a separate, dedicated BI platform is not a sustainable approach. Analytical views represent a unique, native approach to query acceleration in data lakes, providing users with significant performance benefits:

  • Queries from apps are automatically routed to analytical views with matching SQL expressions.
  • Predictable workloads (querying) can be optimized and completed within a few seconds.
  • As the workload becomes more predictable, the automatic use of analytical views increases.
  • Analytical views that are well-partitioned (and partitioned identically to the base tables) enable incremental refresh.

The beauty of analytical views is that you don’t need to create and continuously refine your own data cube. Analytical views kick in automatically and can optimize for joins, distinct counts, medians, etc. Since your BI applications are built against the base data, you work with a single unified view of the data with access to all fields, even though specific reports may be supported by different analytical views.

An analytical view gathers and maintains aggregated data based on the query used to create it. Think of it as a shadow to the base tables. It is built using syntax similar to creating a logical view. An analytical view tracks aggregates for columns represented in its query and keeps them updated. Queries using an analytical view gain a significant performance benefit and utilize fewer system resources as compared to running the query against base tables.

When a query is run that can be partially or entirely answered by an analytical view, ArcEngine, the core analytics engine in Arcadia Enterprise, automatically uses that analytical view. The end user of the query is completely unaware of the analytical view. This is helpful because the dashboards that run the queries are built against base tables, not separate data structures, so end users don’t need to think about how best to run their queries.

Here is an example of a base table and an analytical view:

Base table

CREATE EXTERNAL TABLE events
(event_id STRING,
app_id STRING,
app_instance_id STRING,
time TIMESTAMP,
user_id STRING,
device_id STRING,
platform STRING)
PARTITIONED BY (year INT, month INT, day INT);

Analytical view

CREATE ANALYTICAL VIEW events_month_platform_view
PARTITIONED BY (year, month) STORED AS PARQUET AS
(SELECT count(device_id) as count_device_id,
count(user_id) as count_user_id,
month,
platform
FROM events
GROUP BY month, platform);

Refresh the analytical view

REFRESH ANALYTICAL VIEW events_month_platform_view;

In this example, the events table is comprised of data generated by a sensor. This data can have multiple dashboards built on it. An analytical view called events_month_platform_view has been created that tracks the count of users and devices by month and platform. If an analytical view has been outdated due to new or modified data, you can update it incrementally by refreshing it (as long as the partitions of the analytical view are a subset of the partitions of the base table). As you would expect, refreshing incrementally will reduce the time needed to bring the analytical view fully up-to-date.

Defining analytical views starts with the BI developer/analyst understanding which dashboards and underlying queries will be deployed to business users. If you know which queries need acceleration, you can create analytical views manually.

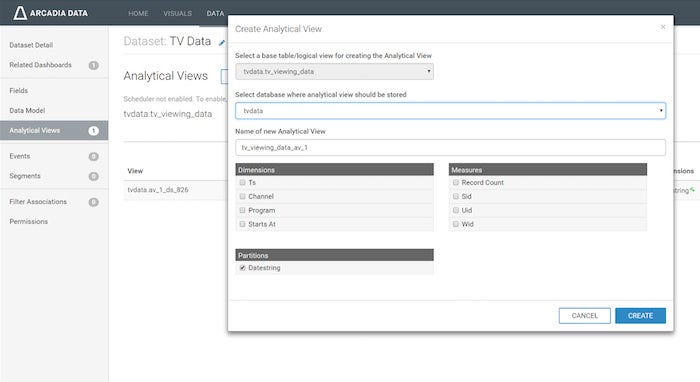
Analytical views can be created manually, or automatically by the system. If you know exactly which queries need acceleration, they can be created manually via the command line as shown in the example above, or by using the Arcadia Enterprise “Create Analytical View” UI as shown in the figure below.

arcadia enterprise analytical viewsArcadia Data

The manual option for creating analytical views in the Arcadia Enterprise UI.

However, many times you do not know exactly which queries need to be accelerated, or what is the best combination of analytical views, which is where Smart Acceleration fits in. Smart Acceleration will identify which analytical views to build with its recommendation engine for the dashboards and visuals you select for acceleration.

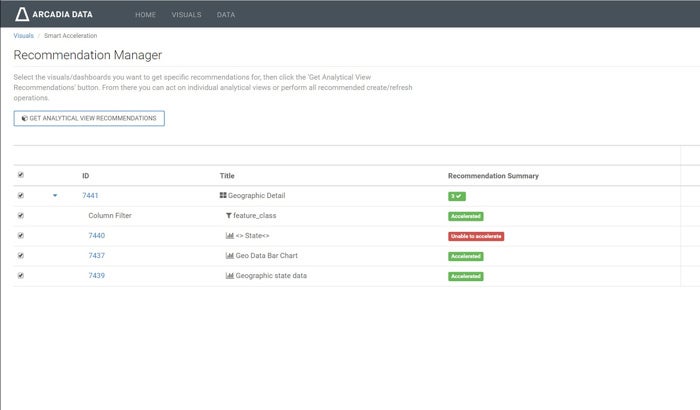
With the Smart Acceleration Recommendation Manager UI (see below), you can select which dashboards or visuals to accelerate, and the system will provide a list of analytical views you can create. The recommended analytical views are defined based on real-world usage of the dashboards, and will identify the most broadly applicable analytical views so that multiple queries can use the same analytical view. This minimizes redundancy across analytical views and guards against system bloat when building views.

arcadia enterprise smart accelerationArcadia Data

Arcadia Enterprise’s Smart Acceleration Recommendation Manager simplifies the process of accelerating queries.

If you face long delays in getting data to an analytics-ready state for your business users due to extensive performance modeling, or you aren’t getting the query responsiveness that your end users need, then Arcadia Enterprise analytical views and Smart Acceleration are likely the technologies you need.

Semantic layers and analytical views for modern BI

Business analysts and power users today often have the data knowledge needed to explore data sets and document the business meaning. These users can more accurately design and maintain accurate, business-friendly semantic data layers. To leverage their knowledge and avoid IT bottlenecks, businesses need a platform that empowers non-technical users to create a semantic layer as a precursor to building dashboards, visualizations, and data applications.

1 2 Page 2

Arcadia Enterprise puts discovery and semantic modeling in adjacent tasks to greatly reduce the time to build visualizations. And with Smart Acceleration, Arcadia Enterprise can make recommendations on how to optimize queries with analytical views. The combination of analytical views and Smart Acceleration allows Arcadia Enterprise to support large numbers of concurrent users without the delays of performance modeling that are typical of OLAP cube-oriented environments.

Once analytical views are created, they need to be refreshed as the underlying data gets updated. Refreshes can be run automatically by a scheduler job at regular intervals. Incremental refreshes usually take little time, since they are aggregating data from new or updated partitions.

From this point onward, your dashboards are ready to be operationalized, making the data lake a unified platform for data discovery, as well as a foundation for production analytics applications for use cases spanning 360-degree customer views to cybersecurity, supply chain analysis, and communications network performance optimization.

Priyank Patel is co-founder and chief product officer at Arcadia Data, where he leads the charge in building visually beautiful and highly scalable analytical products. Prior to co-founding Arcadia, he was part of the founding engineering team at Aster Data, where he designed core components of the Aster Database. He later transitioned into field roles to win the company’s first customers in the Eastern US region and then into product management for the SQL-MapReduce and Analytical Frameworks. Following Teradata’s acquisition of Aster, Priyank led product management for its Big Data Appliance in close partnership with Hortonworks.

New Tech Forum provides a venue to explore and discuss emerging enterprise technology in unprecedented depth and breadth. The selection is subjective, based on our pick of the technologies we believe to be important and of greatest interest to InfoWorld readers. InfoWorld does not accept marketing collateral for publication and reserves the right to edit all contributed content. Send all inquiries to newtechforum@infoworld.com.

Source: InfoWorld Big Data

IDG Contributor Network: Tales of eTail West, big data, and e-commerce success—or failure

IDG Contributor Network: Tales of eTail West, big data, and e-commerce success—or failure

I attend the eTail West event, annually if I am able, because that’s where the enablers hang out. The worlds of retail, fashion, and e-commerce offer plenty of glitz and glamor. If what you are looking for, however, are serious discussions and actionable business opportunities with the big data and analytics providers, and like-minded brands and retailers, that are putting data-driven strategies and systems in place to make retail and e-commerce go, eTail West is a great place for that.

It was at eTail West last year that a series of events began unfolding that opened my eyes as to some changing realities in data and commerce. None of these is especially noteworthy on its own, but collectively, they speak to the occasionally eye-popping results that are possible when companies put actionable analytics to work across their operations—and to the disappointment, and questioning, that can occur when they (apparently) do not.

At eTail West 2017, I had my normal full schedule of briefings and events with vendors, brands, and retailers in full swing when sales types in one of our world regions picked up the red phone to our company’s top executives, whereupon said execs reached out, um, enthusiastically to me to put together something sizable and crucial about 24 hours. The mission: Create an analysis on spec in the hopes of dazzling a hot sales prospect in the aforementioned red-phone region. The subject: how effectively an entity I refer to as the Retail Death Star uses analytic insights to bedevil the competition. Using a bracing combination of secondary and primary research, analyst magic, and Starbucks, I pulled it off to (muffled internal) applause. I analyzed how the Death Star is combining some truly high-quality third-party vendor offerings with its own internal data smarts to create systems and processes that use data about a lot of relevant things including the weather to anticipate and meet consumer demand.

The Death Star is not ‘killing it’ for this online shopper

My command performance, however, is not really the point. This is. Over the past year, intrigued by the fireworks and hurrahs emanating from the Death Star, seeing its acquisition of a property that looked it should propel the Death Start into the thick of the e-commerce derb and noting its more aggressive e-commerce posture in the market, as well as its whiz-bang new website, I have placed two online orders with the Death Star.

The Death Star has now gone two-for-two on those orders.

As in, it has promised me rapid delivery of these items guaranteed to help me save money and live better and sent me upbeat updates tracking the fulfillment process …before ultimately failing to complete both orders. These were not by any stretch of the imagination, in the words of the Bon Qui Qui character on MadTV, “complicated orders.” The most recent one was for a cocoa welcome mat. After sending me promise after promise—including an email it sent on 19 April guaranteeing delivery on 18 April—the Death Star did what I suppose it knows best: lowering the price and dropping the shipping charges. It did so only after I had reached out wanting to know where our order was, but I suppose it’s the discount that counts. In the end, though, after all the order intrigue, the Death Star left me feeling order-unfilled.

If this is what hot competition for Amazon’s e-commerce dominance looks like, Jeff Bezos can sleep even more soundly tonight on his comfy cushion of billions.

Enthusiastic product presentation and order execution followed by fulfillment failure mean one thing: the kinds of data gaps, disconnects, and mismatches we at Stratecast have been analyzing for years that are blowing a several-trillion-dollar hole in global retail and e-commerce economy.

Two-day delivery? Same-day delivery? How do you feel about delivery in minutes?

My purchase was ordered, promised, tracked, and showed up, on time and without a hitch.

“So, what? We all know about Amazon.” So, this: at eTail West 2018 I encountered a company that is positioning itself to give both Amazon and the Death Star a run for their money, and which made me feel a whole lot better about the state of competition in e-commerce.

JD.com claims to be China’s largest online retailer and largest overall retailer, as well as the country’s largest Internet company by revenue, and one of the top three e-commerce sites on the planet.

Retailers must grapple with the move toward everyone expecting to be able to obtain virtually anything by pushing a button. That and four other data-driven megatrends are shaping global markets: artificial intelligence moving into virtually every aspect of business and society; increasing social connectedness not merely for social interaction purposes, but to drive transactions and commerce; organizations controlling more of the supply chain themselves to reduce risk and increase customer experience; and, as part of that expansion, experimenting with drones to speed delivery of physical products to customers and reduce costs.

JD.com is stepping up in all of these areas, and its shopping app and e-commerce website are just the beginning. The company now has control of much of its supply chain, leaving nothing to chance in terms of ordering, merchandise, inventory, or fulfillment. It receives a lot of its orders via the WeChat messaging platform, which enjoys a Facebook Messenger level of ubiquity in China and is already a thriving e-commerce engine there. JD.com also has bustling AI and robotics labs and is experimenting with drones to handle fulfillment. It is also tapping into the trend toward “Uberization”: Employees can deliver goods to customers located in range of their daily commute and are paid their regular wages and mileage costs to do so.

Competitors have captured much attention (particularly in the US) for offering free two-day shipping, and even same-day delivery on many items. JD.com is using a razor-sharp command of data and distribution to beat even that. By crunching massive amounts of data to perform predictive analytics in real time, JD.com is able to predict purchases with such timeliness and accuracy that in many cases it is able, for example, to station JD.com delivery teams at the edges of residential centers with goods for which consumers are imminently placing orders; in some cases, consumers are receiving their orders in minutes.

What about ‘that other China e-commerce competitor’ and stock market darling?

Great, you ask, but where is Alibaba in all this? For its part, Alibaba positions itself as China’s (“and by some measures, the world’s”) largest online commerce company. Alibaba handles more business than any other e-commerce company, and transactions on its online sites totaled $248 billion last year, more than those of eBay and Amazon.com combined.

Much of JD.com’s competitive thrust versus Alibaba in their common home market of China comes down to supply chain and distribution. JD.com controls much of the native infrastructure in China with regard to shipping and other logistics. More broadly, though, it commands a range of commerce and logistical capabilities that would take the combination of Amazon, WeChat, and FedEx to match.

Ultimately the success of JD.com and Alibaba on the world stage is going to hinge on the ability of each to drive revenue in the Americas. JD.com is moving rapidly toward expanding into the US; US businesses have already exported an estimated $15 billion to $20 billion in goods to Alibaba customers in China.

Whoever wins the battle for e-commerce supremacy in China, and other battles in other nations and regions, one thing about which I am certain is that avoiding a global monopoly on a broad swath of the goods and services we all need or want is kind of important. Another is that data holds the key.

This article is published as part of the IDG Contributor Network. Want to Join?

Source: InfoWorld Big Data

IDG Contributor Network: Big data + AI: Context, trust, and other key secrets to success

IDG Contributor Network: Big data + AI: Context, trust, and other key secrets to success

When Target deduced that a teenager from Minnesota was pregnant—and told her father about it before she’d broken the news herself—it was a reminder of just how powerful data analytics can be, and how companies must wield that power carefully.

Several years later, big data and machine learning are being used together more and more in business, providing a powerful engine for personalized marketing, fraud detection, cybersecurity and many other uses. A 2017 survey from Accenture found that 85 percent of executives plan to invest extensively in AI-related technologies over the next three years.

But machine learning doesn’t merely take existing problems and solve them more quickly. It’s an entirely new model that can address new types of problems, spur innovation, and uncover opportunities. To take advantage of it, businesses and users need to rethink some of their approaches to analytics and be aware of AI’s strengths and weaknesses.

Machine learning today, like AI in general, is both incredibly smart and incredibly dumb. It can look through vast amounts of data with great speed and accuracy, identifying patterns and connections that might have gone unnoticed before, but it does so without the broader context and awareness that people take for granted. Thus, it can divine that a girl is pregnant, but has no idea how to act on that information in an appropriate way.

As you embed machine learning into your own analytics processes, here are four areas you should be aware of to maximize the opportunities it presents.

Context is king

Machine learning can yield compelling insights within the scope of the information it has, but it lacks the wider context to know which results are truly useful. A query about what clothes a retailer should stock in its Manhattan store, for example, might return ten suggestions based on historic sales and demographic data, but some of those suggestions may be entirely impractical or things you’ve tried before. In addition, machines need people to tell them which data sets will be useful to analyze; if AI isn’t programmed to take a variable into account, it won’t see it. Business users must sometimes provide the context—as well as plain common sense—to know which data to look at and which recommendations are useful.

Cast a wide net

Machine learning can uncover precisely the answer you’re looking for—but it’s far more powerful when it uncovers something you didn’t know to ask. Imagine you’re a bank, trying to identify the right incentives to persuade your customers to take out another loan. Machine learning can crunch the numbers and provide an answer—but is securing more loans really the goal? If your objective is to increase revenue, your AI program might have even better suggestions, like opening a new branch, but you won’t know unless you define your query in a broad enough way to encompass other responses. AI needs latitude to do its best work, so don’t limit your queries based on assumptions.

Trust the process

One of the marvels of AI is that it can figure things out and we never fully understand how it did it. When Google built a neural network and showed it YouTube videos for a week, the program learned to identify cats even though it had never been trained to do so. That type of mystery is fine for an experiment like Google’s, but what about in business?

One of the biggest challenges for AI is trust. People are less likely to trust a new technology if they don’t know how it arrived at an answer, and with machine learning that’s sometimes the case. The insights may be valuable, but business users need to trust the program before they can act on them. That doesn’t mean accepting every result at face value (see “context” above), but users prefer the ability to see how a solution was arrived at. As with people, it takes time to build trust, and it often forms after we’ve seen repeated good results. At first, we feel the need to verify the output, but once an algorithm has proved itself reliable the trust becomes implicit.

Act responsibly

Target isn’t the only company that failed to see how the power of data analytics could backfire. After Facebook failed to predict how its data could be used by a bad actor like Cambridge Analytica, the best excuse it could muster was that it didn’t see it coming. “I was maybe too idealistic,” Mark Zuckerberg said. For all the good it brings, machine learning is a powerful capability and companies must be aware of potential consequences of its use. This can include how analytics results are used by employees, as in Target’s case, and also how data might be used by a third party when it’s shared. Naivety is rarely a good look, especially in business.

The use of AI is expanding as companies seek new opportunities for growth and efficiency, but technologies like machine learning need to be used thoughtfully. Sometimes the technology is embedded deep within applications, and not every employee needs to know that AI is at work behind the scenes. But for some uses, results need to be assessed critically to ensure they make good business sense. Despite its intelligence, artificial intelligence is still just that—artificial—and it takes people to get maximize its use. Keeping the above recommendations in mind will help you do just that.

This article is published as part of the IDG Contributor Network. Want to Join?

Source: InfoWorld Big Data

Review: Amazon SageMaker scales deep learning

Review: Amazon SageMaker scales deep learning

Amazon SageMaker, a machine learning development and deployment service introduced at re:Invent 2017, cleverly sidesteps the eternal debate about the “best” machine learning and deep learning frameworks by supporting all of them at some level. While AWS has publicly supported Apache MXNet, its business is selling you cloud services, not telling you how to do your job.

SageMaker, as shown in the screenshot below, lets you create Jupyter notebook VM instances in which you can write code and run it interactively, initially for cleaning and transforming (feature engineering) your data. Once the data is prepared, notebook code can spawn training jobs in other instances, and create trained models that can be used for prediction. SageMaker also sidesteps the need to have massive GPU resources constantly attached to your development notebook environment by letting you specify the number and type of VM instances needed for each training and inference job.

Trained models can be attached to endpoints that can be called as services. SageMaker relies on an S3 bucket (that you need to provide) for permanent storage, while notebook instances have their own temporary storage.

SageMaker provides 11 customized algorithms that you can train against your data. The documentation for each algorithm explains the recommended input format, whether it supports GPUs, and whether it supports distributed training. These algorithms cover many supervised and unsupervised learning use cases and reflect recent research, but you aren’t limited to the algorithms that Amazon provides. You can also use custom TensorFlow or Apache MXNet Python code, both of which are pre-loaded into the notebook, or supply a Docker image that contains your own code written in essentially any language using any framework. A hyperparameter optimization layer is available as a preview for a limited number of beta testers.

Source: InfoWorld Big Data

The era of the cloud database has finally begun

The era of the cloud database has finally begun

Folks, it’s happening. Although enterprises have spent the last few years shifting on-premises workloads to the public cloud, databases have been a sticking point. Sure, Amazon Web Services can point to 64,000 database migrations over the last two years, but that still leaves millions more stuck in corporate datacenters.

But not, it would appear, for long.

Ryanair, Europe’s largest airline, just signaled a significant shift in cloud migrations, announcing that it is “going all-in” on AWS, moving its infrastructure to the cloud leader. But what makes this so important is that it also includes mention of Ryanair moving away from Microsoft SQL Server and replacing it with Amazon Aurora, “standardizing on … AWS databases.”

When companies embrace cloud databases wholesale, it’s effectively game over.

Why migrating databases to the cloud has been so hard

Source: InfoWorld Big Data

Watch Tech Talk on May 17 for an in-depth GDPR discussion

Watch Tech Talk on May 17 for an in-depth GDPR discussion

Computerworld | May 8, 2018

The GDPR deadline is coming up fast, and most businesses in the U.S. aren’t ready yet. Join Ken Mingis and his panel of experts as they discuss the impact of the new rules and what U.S. organizations must do now to protect customer data. Find the show here on May 17.

Source: InfoWorld Big Data