3 big data platforms look beyond Hadoop

3 big data platforms look beyond Hadoop

A distributed file system, a MapReduce programming framework, and an extended family of tools for processing huge data sets on large clusters of commodity hardware, Hadoop has been synonymous with “big data” for more than a decade. But no technology can hold the spotlight forever.

While Hadoop remains an essential part of the big data platforms, and the major Hadoop vendors—namely Cloudera, Hortonworks, and MapR—have changed their platforms dramatically. Once-peripheral projects like Apache Spark and Apache Kafka have become the new stars, and the focus has turned to other ways to drill into data and extract insight. 

Let’s take a brief tour of the three leading big data platforms, what each adds to the mix of Hadoop technologies to set it apart, and how they are evolving to embrace a new era of containers, Kubernetes, machine learning, and deep learning.

Cloudera Enterprise Data Hub

Cloudera was the first to market with a Hadoop distribution—not surprising given that its core team consisted of engineers who had leveraged Hadoop in places like Yahoo, Google, and Facebook. Hadoop co-creator Doug Cutting serves as chief architect. 

Source: InfoWorld Big Data

IDG Contributor Network: Data lakes: Just a swamp without data governance and catalog

IDG Contributor Network: Data lakes: Just a swamp without data governance and catalog

The big data landscape has exploded in an incredibly short amount of time. It was just in 2013 that the term “big data” was added to the pages of the Oxford English Dictionary. Fewer than five years later, 2.5 quintillion bytes of data is being generated every day. In response to the creation of such vast amounts of raw data, many businesses recognized the need to provide significant data storage solutions such as data warehouses and data lakes without much thought.

On the surface, more modernized data lakes hold an ocean of possibility for organizations eager to put analytics to work. They offer a storage repository for those capitalizing on new transformative data initiatives and capturing vast amounts of data from disparate sources (including social, mobile, cloud applications, and the internet of things). Unlike the old data warehouse, the data lake holds “raw” data in its native format, including structured, semistructured, and unstructured data. The data structure and requirements are not defined until the data is needed.

One of the most common challenges organizations face, though, with their data lakes is the inability to find, understand, and trust the data they need for business value or to gain a competitive edge. That’s because the data might be gibberish (in its native format)—or even conflicting. When the data scientist wants to access enterprise data for modeling or to deliver insights for analytics teams, this person is forced to dive into the depths of the data lake, and wade through the murkiness of undefined data sets from multiple sources. As data becomes an increasingly more important tool for businesses, this scenario is clearly not sustainable in the long run.

To be clear, for businesses to effectively and efficiently maximize data stored in data lakes, they need to add context to their data by implementing policy-driven processes that classify and identify what information is in the lake, and why it’s in there, what it means, who owns it, and who is using it. This can best be accomplished through data governance integrated with a data catalog. Once this is done, the murky data lake will become crystal clear, particularly for the users who need it most.

Avoiding the data swamp

The potential of big data is virtually limitless. It can help businesses scale more efficiently, gain an advantage over their competitors, enhance customer service, and more. It may seem, the more data an organization has at its fingertips, the better. Yet that’s not necessarily the case—especially if that data is hidden in the data lake with no governance in place. A data lake without data governance will ultimately end up being a collection of disconnected data pools or information silos—just all in one place.

Data dumped into a data lake is not of business value without structure, processes, and rules around the data. Ungoverned, noncataloged data leaves businesses vulnerable. Users won’t know where the data comes from, where it’s been, with whom they can share it, or if it’s certified. Regulatory and privacy compliance risks are magnified, and data definitions can change without any user’s knowledge. The data could be impossible to analyze or be used inappropriately because there are inaccuracies and/or the data is missing context.

The impact: stakeholders won’t trust results gathered from the data. A lack of data governance transforms a data lake from a business asset to a murky business liability.

The value of a data catalog in maintaining a crystal-clear data lake

The tremendous volume and variety of big data across an enterprise makes it difficult to understand the data’s origin, format, lineage, and how it is organized, classified, and connected. Because data is dynamic, understanding all of its features is essential to its quality, usage, and context. Data governance provides systematic structure and management to data residing in the data lake, making it more accessible and meaningful.

An integrated data governance program that includes a data catalog turns a dark, gloomy data lake into a crystal-clear body of data that is consistently accessible to be consumed, analyzed, and used. Its wide audience of users can glean new insights and solve problems across their organization. A data catalog’s tagging system methodically unites all the data through the creation and implementation of a common language, which includes data and data sets, glossaries, definitions, reports, metrics, dashboards, algorithms, and models. This unifying language allows users to understand the data in business terms, while also establishing relationships and associations between data sets.

Data catalogs make it easier for users to drive innovation and achieve groundbreaking results. Users are no longer forced to play hide-and-seek in the depths of a data lake to uncover data that fits their business purpose. Intuitive data search through a data catalog enables users to find and “shop” for data in one central location using familiar business terms and filters that narrow results to isolate the right data. Similar to sites like Amazon.com, enhanced data catalogs incorporate machine learning, which learns from past user behavior, to issue recommendations on other valuable data sets for users to consider. Data catalogs even make it possible to alert users when data that’s relevant to their work is ingested in the data lake.

A data catalog combined with governance also ensures trustworthiness of the data. A data lake with governance provides assurance that the data is accurate, reliable, and of high quality. The catalog then authenticates the data stored in the lake using structured workflows and role-based approvals of data sources. And it helps users understand the data journey, its source, lineage, and transformations so they can assess its usefulness.

A data catalog helps data citizens (anyone within the organization who uses data to perform their job) gain control over the glut of information stuffed into their data lakes. By indexing the data and linking it to agreed-upon definitions about quality, trustworthiness, and use, a catalog helps users determine which data is fit to use—and which they should discard because it’s incomplete or irrelevant to the analysis at hand.

Whether users are looking to preview sample data or determine how new data projects might impact downstream processes and reports, a data catalog gives them the confidence that they’re using the right data and that it adheres with provider and organizational policies and regulations. Added protections allow for sensitive data to be flagged within a data lake and security protocols can prevent unauthorized users from accessing it.

Realizing data’s potential requires more than just the collection of it in a data lake. Data must be meaningful, consistent, clear, and most important, be cataloged for the users who need it the most. Proper data governance and a first-rate data catalog will transform your data lake from simply being a data repository to a dynamic tool and collaborative workspace that empowers digital transformation across your enterprise.

This article is published as part of the IDG Contributor Network. Want to Join?

Source: InfoWorld Big Data

How to get real value from big data in the cloud

How to get real value from big data in the cloud

According to a recent report from IDC, “worldwide revenues for big data and business analytics will grow from nearly $122 billion in 2015 to more than $187 billion in 2019, an increase of more than 50 percent over the five-year forecast period.”

Anyone in enterprise IT already knows that big data is a big deal. If you can manage and analyze massive amounts of data—I’m talking petabytes—you’ll have access to all sorts of information that will help you run your business better. 

Right? Sadly, for most enterprises, no. 

Here are some hard facts: Cloud computing made big data affordable. Before, you would have to build a new datacenter to house the consolidation of data. Now, you can consolidate data in the cloud, at bargain prices.

How’s that working out? I’m finding that it’s one thing to have both structured and unstructured data in a central location. It’s another thing to make good use of that data for both tactical and strategic reasons.

Too often, enterprises pull together the data but don’t know what to do with it. They lack a systemic understanding of the business opportunities and values that could be gained by leveraging this data. 

What’s often lacking is a data plan. I recommend that every enterprise have a completed data plan before the data is even consolidated in the cloud. This means having a clear and detailed set of use cases for the data (including purpose and value), as well as a list of tools and technologies (such as machine learning and data analytics) that will be used to get the business value out of the data.

The data plan needs to be done before the consolidation for several reasons:

  • Know what data will be leveraged for analytical purposes. I find that that some data that is consolidated is not needed. So you end up paying for database storage for no sound business purpose, as well as hurting analysis performance because the unnecessary data needs to be processed as well. 
  • Understand the meaning of the data, including metadata. This assures that you’re analyzing the right data for the use cases. 
  • Consider a performance plan. If you sort through petabytes of data, that’s a lot of time and cloud dollars spent. How can you optimize?  
  • Have a sound list of data analytics tools. Although many enterprises purchase the most popular tools, you may find that your big data journey takes you to less popular technology that is a better fit. Be sure to explore the market before deciding on your tool set.

A little planning goes a long way. Your business is worth that investment. 

Source: InfoWorld Big Data

What is Julia? A fresh approach to numerical computing

What is Julia? A fresh approach to numerical computing

Julia is a free open source, high-level, high-performance, dynamic programming language for numerical computing. It has the development convenience of a dynamic language with the performance of a compiled statically typed language, thanks in part to a JIT-compiler based on LLVM that generates native machine code, and in part to a design that implements type stability through specialization via multiple dispatch, which makes it easy to compile to efficient code.

In the blog post announcing the initial release of Julia in 2012, the authors of the language—Jeff BezansonStefan KarpinskiViral Shah, and Alan Edelman—stated that they spent three years creating Julia because they were greedy. They were tired of the trade-offs among Matlab, Lisp, Python, Ruby, Perl, Mathematica, R, and C, and wanted a single language that would be good for scientific computing, machine learning, data mining, large-scale linear algebra, parallel computing, and distributed computing.

Who is Julia for? In addition to being attractive to research scientists and engineers, Julia is also attractive to data scientists and to financial analysts and quants.

The designers of the language and two others founded Julia Computing in July 2015 to “develop products that make Julia easy to use, easy to deploy, and easy to scale.” As of this writing, the company has a staff of 28 and customers ranging from national labs to banks to economists to autonomous vehicle researchers. In addition to maintaining the Julia open source repositories on GitHub, Julia Computing offers commercial products, including JuliaPro, which comes in both free and paid versions.

Why Julia?

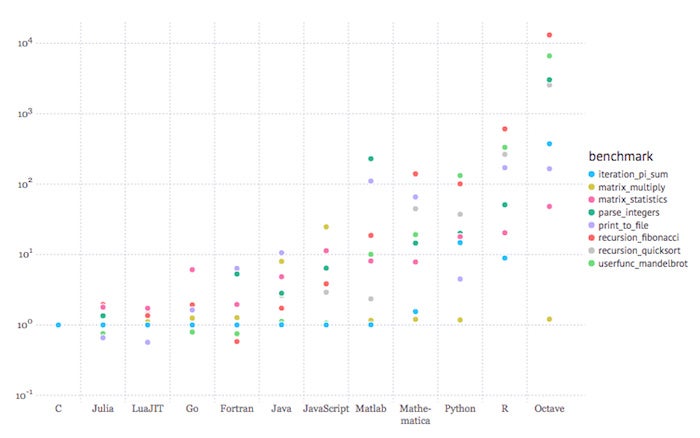
Julia “aims to create an unprecedented combination of ease-of-use, power, and efficiency in a single language.” To the issue of efficiency, consider the graph below:

julia performance comparisonJulia Computing

The figure above shows performance relative to C for Julia and 10 other languages. Lower is better. The benchmarks shown are very low-level tasks. The graph was created using the Gadfly plotting and data visualization system in a Jupyter notebook. The languages to the right of Julia are ordered by the geometric mean of the benchmark results, with LuaJIT the fastest and GNU Octave the slowest.

Julia benchmarks

What we’re seeing here is that Julia code can be faster than C for a few kinds of operations, and no more than a few times slower than C for others. Compare that to, say, R, which can be almost 1,000 times slower than C for some operations.

Note that one of the slowest tests for Julia is Fibonacci recursion; that is because Julia currently lacks tail recursion optimization. Recursion is inherently slower than looping. For real Julia programs that you want to run in production, you’ll want to implement the loop (iteration) form of such algorithms.

Julia JIT compilation

There is a cost to the JIT (just-in-time) compiler approach as opposed to a pure interpreter: The compiler has to parse the source code and generate machine code before your code can run. That can mean a noticeable start-up time for Julia programs the first time each function and macro runs in a session. So, in the screenshot below, we see that the second time we generate a million random floating point numbers, the time taken is an order of magnitude less than on the first execution. Both the @time macro and the rand() function needed to be compiled the first time through the code, because the Julia libraries are written in Julia.

julia> @time rand(10^6);
0.62081 seconds (14.44 k allocations: 8.415 MiB)

julia> @time rand(10^6);
0.004881 seconds (7 allocations: 7.630 MiB)

Julia fans claim, variously, that it has the ease of use of Python, R, or even Matlab. These comparisons do bear scrutiny, as the Julia language is elegant, powerful, and oriented towards scientific computing, and the libraries supply a broad range of advanced programming functionality.

Julia example

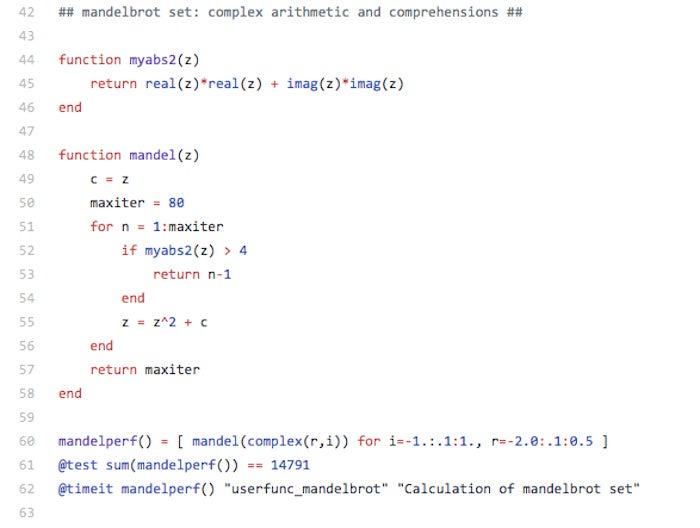
As a quick Julia language example, consider the following Mandelbrot set benchmark code:

julia mandelbrot setIDG

Mandelbrot set benchmark in Julia. 

As you can see, complex number arithmetic is built into the language, as are macros for tests and timing. As you can also see, the trailing semicolons that plague C-like languages, and the nested parentheses that plague Lisp-like languages, are absent from Julia. Note that mandelperf() is called twice, in lines 61 and 62. The first call tests the result for correctness and does the JIT-compilation; the second call gets the timing.

Julia programming

Julia has many other features worth mentioning. For one, user-defined types are as fast and compact as built-ins. In fact, you can declare abstract types that behave like generic types, except that they are compiled for the argument types that they are passed.

For another, Julia’s built-in code vectorization means that there is no need for a programmer to vectorize code for performance; ordinary devectorized code is fast. The compiler can take advantage of SIMD instructions and registers if present on the underlying CPU, and unroll the loops in a sequential process to vectorize them as much as the hardware allows. You can mark loops as vectorizable with the @simd annotation.

Julia parallelism

Julia was also designed for parallelism and distributed computation, using two primitives: remote references and remote calls. Remote references come in two flavors: Future and RemoteChannel. A Future is the equivalent of a JavaScript promise; a RemoteChannel is rewritable and can be used for inter-process communication, like a Unix pipe or a Go channel. Assuming that you have started Julia with multiple processes (e.g. julia -p 8 for an eight-core CPU such as an Intel Core i7), you can @spawn or remotecall() function calls to execute on another Julia process asynchronously, and later fetch() the Future returned when you want to synchronize and use the result.

If you don’t need to run on multiple cores, you can utilize lightweight “green” threading, called a Task() in Julia and a coroutine in some other languages. A Task() or @task works in conjunction with a Channel, which is the single-process version of RemoteChannel.

Julia type system

Julia has an unobtrusive yet powerful type system that is dynamic with run-time type inference by default, but allows for optional type annotations. This is similar to TypeScript. For example:

julia> (1+2)::AbstractFloat
ERROR: TypeError: typeassert: expected AbstractFloat, got Int64
julia> (1+2)::Int
3

Here we are asserting an incompatible type the first time, causing an error, and a compatible type the second time.

Julia strings

Julia has efficient support for Unicode strings and characters, stored in UTF-8 format, as well as efficient support for ASCII characters, since in UTF-8 the code points less than 0x80 (128) are encoded in a single character. Otherwise, UTF-8 is a variable-length encoding, so you can’t assume that the length of a Julia string is equal to the last character index.

Full support for UTF-8 means, among other things, that you can easily define variables using Greek letters, which can make scientific Julia code look very much like the textbook explanations of the formulas, e.g. sin(2π). A transcode() function is provided to convert UTF-8 to and from other Unicode encodings.

C and Fortran functions

Julia can call C and Fortran functions directly, with no wrappers or special APIs needed, although you do need to know the “decorated” function name emitted by the Fortran compiler. The external C or Fortran function must be in a shared library; you use the Julia ccall() function for the actual call out. For example, on a Unix-like system you can use this Julia code to get an environment variable’s value using the getenv function in libc:

function getenv(var::AbstractString)
val = ccall((:getenv, "libc"),
Cstring, (Cstring,), var)
if val == C_NULL
error("getenv: undefined variable: ", var)
end
unsafe_string(val)
end

julia> getenv("SHELL")
"/bin/bash"

Julia macros

Julia has Lisp-like macros, as distinguished from the macro preprocessors used by C and C++. Julia also has other meta-programming facilities, such as reflection, code generation, symbol (e.g. :foo) and expression (e.g. :(a+b*c+1) ) objects, eval(), and generated functions. Julia macros are evaluated at parsing time.

Generated functions, on the other hand, are expanded when the types of their parameters are known, prior to function compilation. Generated functions have the flexibility of generic functions (as implemented in C++ and Java) and the efficiency of strongly typed functions, by eliminating the need for run-time dispatch to support parametric polymorphism.

GPU support

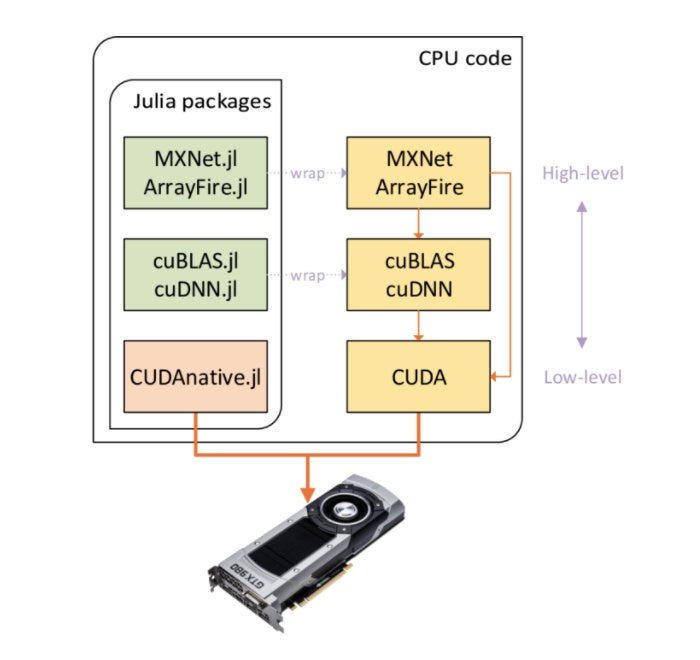
Julia has GPU support using, among others, the MXNet deep learning package, the ArrayFire GPU array library, the cuBLAS and cuDNN linear algebra and deep neural network libraries, and the CUDA framework for general purpose GPU computing. The Julia wrappers and their respective libraries are shown in the diagram below.

julia gpu packagesJulia Computing

You can draw on a number of Julia packages to program GPUs at different abstraction levels. 

JuliaPro and Juno IDE

You can download the free open source Julia command line for Windows, MacOS, generic Linux, or generic FreeBSD from the Julia language site. You can clone the Julia source code repository from GitHub.

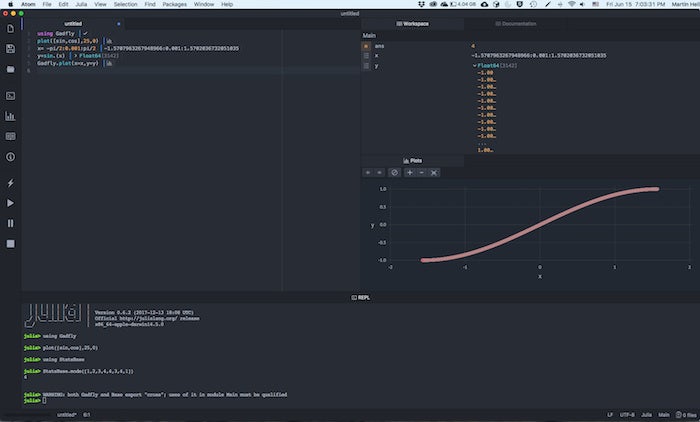
Alternatively you can download JuliaPro from Julia Computing. In addition to the compiler, JuliaPro gives you the Atom-based Juno IDE (shown below) and more than 160 curated packages, including visualization and plotting.

Beyond what’s in the free JuliaPro, you can add subscriptions for enterprise support, quantitative finance functionality, database support, and time series analysis. JuliaRun is a scalable server for a cluster or cloud.

julia juno ideIDG

Juno is a free Julia IDE based on the Atom text editor. 

Jupyter notebooks and IJulia

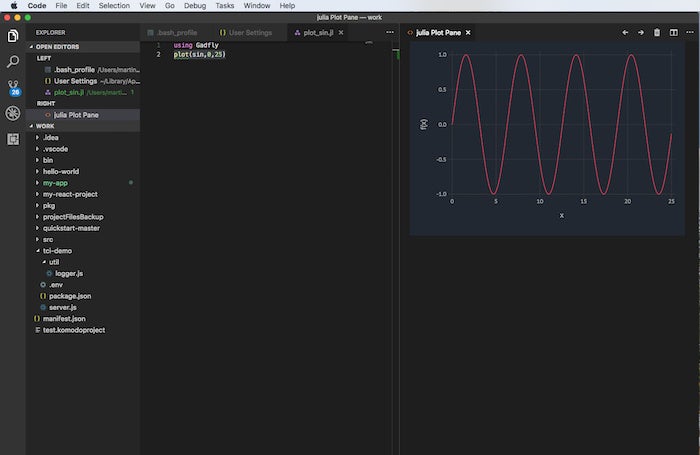
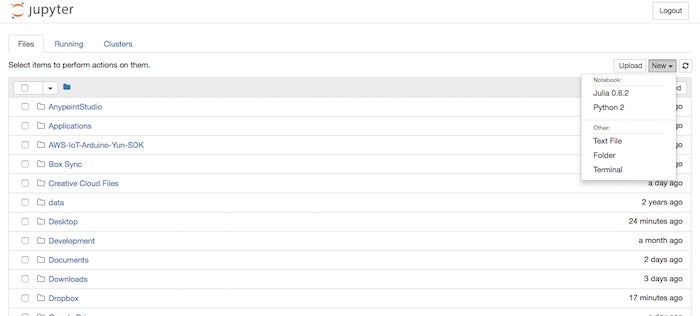
In addition to using Juno as your Julia IDE, you can use Visual Studio Code with the Julia extension (shown directly below), and Jupyter notebooks with the IJulia kernel (shown in the second and third screenshots below). You may need to install Jupyter notebooks for Python 2 or (preferably) Python 3 with Anaconda or pip.

julia visual studio codeIDG

Visual Studio Code with the Julia extension. 

julia jupyter notebookIDG

Launching a Julia kernel from Jupyter notebook.

julia jupyter sine plotIDG

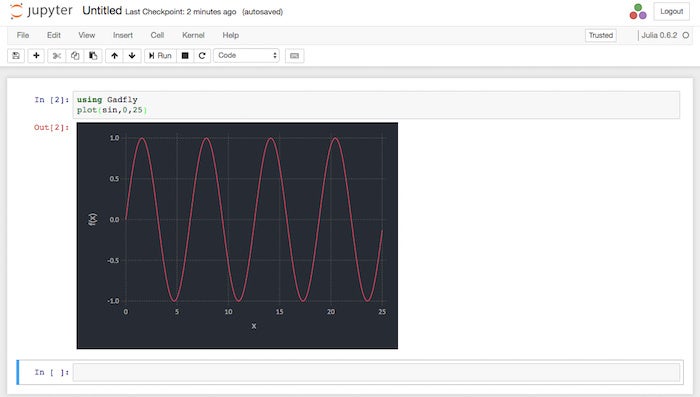
Plotting a sine wave using Julia in a Jupyter notebook.

JuliaBox

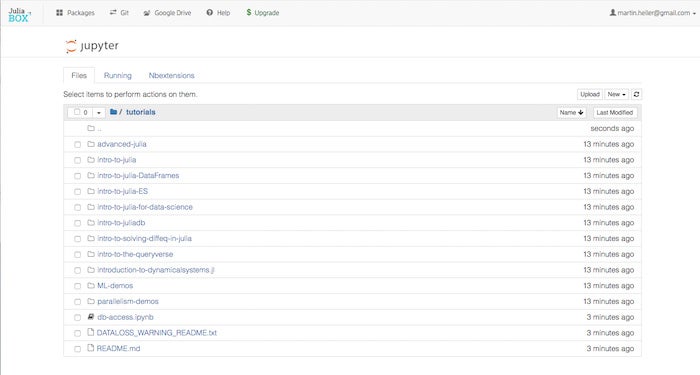
You can run Julia in Jupyter notebooks online using JuliaBox (shown below), another product of Julia Computing, without doing any installation on your local machine. JuliaBox currently includes more than 300 packages, runs Julia 0.6.2, and contains dozens of tutorial Jupyter notebooks. The top-level list of tutorial folders is shown below. The free level of JuliaBox access gives you 90-minute sessions with three CPU cores; the $14 per month personal subscription gives you four-hour sessions with five cores; and the $70 per month pro subscription gives you eight-hour sessions with 32 cores. GPU access is not yet available as of June 2018.

julia juliabox tutorialsIDG

JuliaBox runs Julia in Jupyter notebooks online. 

Julia packages

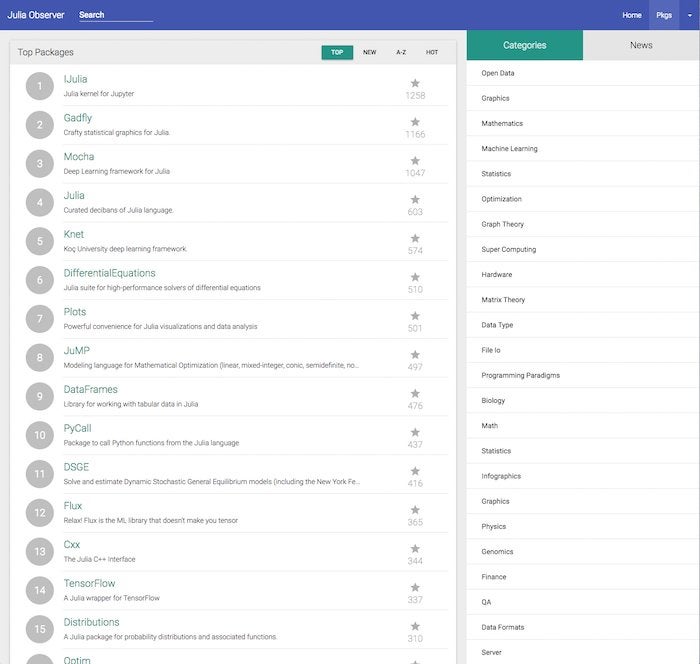
Julia “walks like Python, but runs like C.” As my colleague Serdar Yegulalp wrote in December 2017, Julia is starting to challenge Python for data science programming, and both languages have advantages. As an indication of the rapidly maturing support for data science in Julia, consider that there are already two books entitled Julia for Data Science, one by Zacharias Voulgaris, and the other by Anshul Joshi, although I can’t speak to the quality of either one.

If you look at the overall highest-rated Julia packages from Julia Observer, shown below, you’ll see a Julia kernel for Jupyter notebooks, the Gadfly graphics package (similar to ggplot2 in R), a generic plotting interface, several deep learning and machine learning packages, differential equation solvers, DataFrames, New York Fed dynamic stochastic general equilibrium (DSGE) models, an optimization modeling language, and interfaces to Python and C++. If you go a little farther down this general list, you will also find QuantEcon, PyPlot, ScikitLearn, a bioinformatics package, and an implementation of lazy lists for functional programming.

julia top packagesIDG

Julia’s top packages. 

If the Julia packages don’t suffice for your needs, and the Python interface doesn’t get you where you want to go, you can also install a package that gives you generic interfaces to R (RCall) and Matlab.

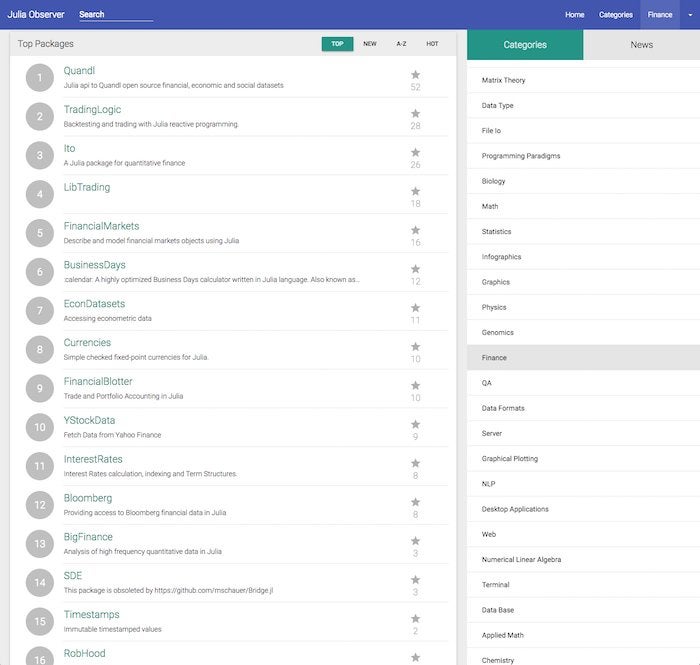
Julia for financial analysts and quants

Quants and financial analysts will find many free packages to speed their work, as shown in the screenshot below. In addition, Julia Computing offers the JuliaFin suite, consisting of Miletus (a DSL for financial contracts), JuliaDB (a high performance in-memory and distributed database), JuliaInXL (call Julia from Excel sheets), and Bloomberg connectivity (access to real-time and historical market data).

julia top finance packagesIDG

Julia’s top finance packages. 

1 2 Page 2

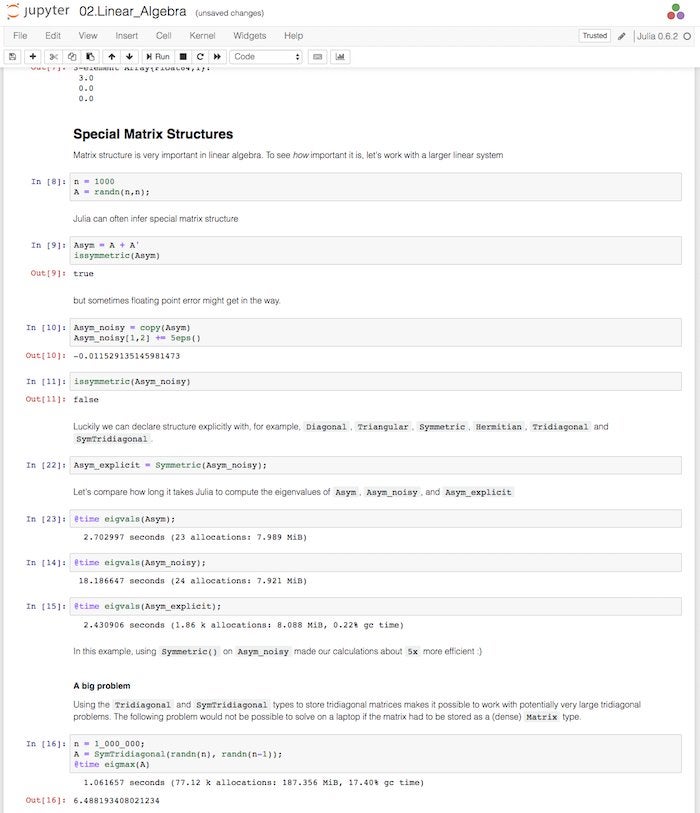
Julia for researchers

Researchers will find many packages of interest, as you can see from the category names in the right-hand column above. In addition, many of the base features of the Julia language are oriented towards science, engineering, and analysis. For example, as you can see in the screenshot below, matrices and linear algebra are built into the language at a sophisticated level.

julia juliabox linear algebraIDG

Julia offers sophisticated support for multi-dimensional arrays and linear algebra operations. 

Learn Julia

As you’ve seen, you can use Julia and many packages for free, and buy enterprise support and advanced features if you need them. There are a few gotchas to consider as you’re starting to evaluate Julia.

First, you need to know that ordinary global variables make Julia slow. That’s because variables at global scope don’t have a fixed type unless you’ve declared one, which in turn means that functions and expressions using the global variable have to handle any type. It’s much more efficient to declare variables inside the scope of functions, so that their type can be determined and the simplest possible code to use them can be generated.

Second, you need to know that variables declared at top level in the Julia command line are global. If you can’t avoid doing that, you can make performance a little better (or less awful) by declaring them const. That doesn’t mean that the value of the variable can’t change—it can. It means that the type of the variable can’t change.

Finally, read the Julia manual and the official list of Julia learning resources. In particular, read the getting started section of the manual and watch Jane Herriman’s introductory tutorial and any other videos in the learning resources that strike you as relevant. If you would prefer to follow along on your own machine rather than on JuliaBox, you may want to clone the JuliaBoxTutorials repo from GitHub and run the Local_installations notebook from Jupyter to install all the packages needed.

Source: InfoWorld Big Data

IDG Contributor Network: In an age of fake news, is there really such a thing as fake data?

IDG Contributor Network: In an age of fake news, is there really such a thing as fake data?

Deloitte Global predicts that medium and large enterprises will increase their use of machine learning in 2018, doubling the number of implementations and pilot projects underway in 2017. And, according to Deloitte, by 2020, that number will likely double again.

Machine learning is clearly on the rise among companies of all sizes and in all industries and depends on data so they can learn. Training a machine learning model requires thousands or millions of data points, which need to be labeled and cleaned. Training data is what makes apps smart, teaching them life lessons, experiences, sights, and rules that help them know how to react to different situations. What a developer of an AI app is really trying to do is simulate the experiences and knowledge that take people lifetimes to accrue.

The challenge many companies face in developing AI solutions is acquiring all the needed training data to build smart algorithms. While companies maintain data internally across different databases and files, it would be impossible for a company to quickly possess the amount of data that is needed. Only tech savvy, forward-thinking organizations that began storing their data years ago could even begin to try.

As a result, a new business is emerging that essentially sells synthetic data—fake data, really—that mimics the characteristics of the real deal. Companies that tout the benefits of synthetic data claim that effective algorithms can be developed using only a fraction of pure data, with the rest being created synthetically. And they claim that it drastically reduces costs and save time. But does it deliver on these claims?

Synthetic data: buyer beware

When you don’t have enough real data, just make it up.  Seems like an easy answer, right? For example, if I’m training a machine learning application to detect the number of cranes on a construction site, and I only have examples of 20 cranes, I could create new ones by changing the color of some cranes, the angles of others and the size of them, so that the algorithm is trained to identify hundreds of cranes.  While this may seem easy and harmless enough, in reality, things are not that easy. The quality of a machine learning application is directly proportional to the quality of the data with which it is trained. 

Data needs to work accurately and effectively in the real world. Users of synthetically derived data have to take a huge leap of faith that it will train a machine learning app to work out in the real world and that every scenario that the app will encounter has been addressed. Unfortunately, the real world doesn’t work that way.  New situations are always arising that no one can really predict with any degree of accuracy. Additionally, there are unseen patterns in the data that you just can’t mimic.

Yet, while accumulating enough training data the traditional way could take months or years, synthetic data is developed in weeks or months. This is an attractive option for companies looking to swiftly deploy a machine learning app and begin realizing the business benefits immediately. In some situations where many images need to be identified quickly to eliminate manual, tedious processes, maybe it’s okay to not have a perfectly trained algorithm—maybe providing 30 percent accuracy is good enough.

But what about the mission- or life-critical situations where a bad decision by the algorithm could result in disaster or even death? Take, for example, a health care app that works to identify abnormalities in X-rays. Or, an autonomous vehicle operating on synthetic training data. Because the app is trained only on what it has learned, what if it was never given data that tells it how to react to real-world possibilities, such as a broken traffic light?

How do you make sure you’re getting quality data in your machine learning app?

Because the use of synthetic data is clearly on the rise, many AI software developers, insights-as-a-service providers and AI vendors are using it to more easily get AI apps up and running and solving problems out of the gate. But when working with these firms, there are some key questions you should ask to make sure you are getting quality machine learning solutions.

Do you understand my industry and the business challenge at hand?

When working with a company developing your machine learning algorithm, it’s important that it understands the specific challenges facing your industry and the critical nature of your business. Before it can aggregate the relevant data and build an AI solution to solve it, the company needs to have an in-depth understanding of the business problem.

How do you aggregate data?

It’s also important for you to know how the provider is getting the data that may be needed. Ask directly if it uses synthetic data and if so, what percentage of the algorithm is trained using synthetic data and how much is from pure data. Based on this, determine if your application can afford to make a few mistakes now and then. 

What performance metrics do you use to assess the solution?

You should find out how they assess the quality of the solution. Ask what measurement tools they use to see how the algorithm operates in real-world situations. Additionally, you should determine how often they retrain the algorithm on new data.

Perhaps most important, you need to assess if the benefits of using synthetic data outweigh the risks. It’s often tempting to follow the easiest path with the quickest results, but sometimes getting it right—even when the road is longer—is worth the journey.

This article is published as part of the IDG Contributor Network. Want to Join?

Source: InfoWorld Big Data

9 Splunk alternatives for log analysis

9 Splunk alternatives for log analysis

Quick! Name a log analysis service. If the first word that popped out of your mouth was “Splunk,” you’re far from alone.

But Splunk’s success has spurred many others to up their log-analysis game, whether open source or commercial. Here is a slew of contenders that have a lot to offer sysadmins and devops folks alike, from services to open source stacks.

Elasticsearch (ELK stack)

The acronym “LAMP” is used to refer to the web stack that comprises Linux, the Apache HTTP web server, the MySQL database, and PHP (or Perl, or Python). Likewise, “ELK” is used to describe a log analysis stack built from Elasticsearch for search functionality, Logstash for data collection, and Kibana for data visualization. All are open source.

Elastic, the company behind the commercial development of the stack, provides all the pieces either as cloud services or as free, open source offerings with support subscriptions. Elasticsearch, Logstash, and Kibana offer the best alternative to Splunk when used together, considering that Splunk’s strength is in searching and reporting as well as data collection.

Source: InfoWorld Big Data

It’s time we tapped APIs for business analytics

It’s time we tapped APIs for business analytics

APIs have become the mechanism of choice for connecting internal and external services, applications, data, identities, and other digital assets. As a result, APIs now have the potential to serve as a similarly valuable mechanism for analytics. Equally important, APIs can provide a significantly easier-to-use alternative to the traditional, ad hoc approaches to data collection and data analysis that have slowed the process of converting information into the intelligence required by today’s data-driven organizations.

The alliance of APIs and analytics is a natural one, since both technologies are critical to streamlining operations and unlocking innovation. Typically, an organization will begin its digital transformation by embracing APIs to enhance the integration of systems and automation of processes. With several comprehensive turnkey API management solutions on the market, enterprise developers can get a system into production in weeks to months, building in integrations to easily fill in any gaps. From there, the team can continuously improve the implementation.

The next step in digital transformation is analytics as enterprises evolve toward becoming data-driven businesses. Among the technologies being employed to understand an organization’s dynamics and help with decision-making are sophisticated data aggregation, machine learning, data mining, and data visualization. Together, they enable enterprise teams to understand the dynamics of the business, detect patterns, and predict future developments. However, the challenges associated with collecting data and building custom analysis have hindered the adoption of analytics. And even when adopted, analytics is nowhere near having the transformational impact once predicted.

This article explores the challenges of embracing analytics using traditional approaches, examines how API management can address these challenges, and presents a solution blueprint for using API management to mine valuable data for analytics.

Roadblocks to analytics adoption

In implementing analytics, organizations face three critical challenges, each of which has the potential to delay or derail the project.

First, unlike with API management, there are no turnkey analytics solutions. Instead, the organization has to build a custom analytics solution by combining different analytics technologies, whether products or open source projects. This, in turn, requires the development team to write a significant amount of code to integrate the necessary technologies, as well as existing systems.

Second, the organization will need to employ data engineers (developers) and data scientists (architects) who have a deep understanding of statistics, machine learning, and systems. These professionals (which are in short supply) will need to decide what insights are useful, determine which key performance indicators (KPIs) to track, design a system to collect data, and get other groups in the organization to add data collection code. They will also have to write their own analysis logic, carry out the actions based on outcomes of analysis by writing more code, and understand, from the first to the nth level, the repercussions of those observations.

Third, to collect data, organizations need to add instrumentation (sensors) across the organization in order to generate events that signal notable activities. Such a project requires coordination across multiple groups—ranging anywhere from 10 to 20 teams in large enterprises. Additionally, organizations may need to wait for the sensors to be shipped to them. As a result, the instrumentation process often is both expensive and time-consuming.

Despite the potential far-reaching impact of analytics, all of these roadblocks have limited the adoption of analytics to date.

The advantages of API-driven analytics

API management has the potential to enable the wider use of analytics due to two factors. First is the extensive adoption of API management solutions, which has been growing at more than 35 percent per year since 2016, driven by the demand from customers and partners to expose business activities as APIs to enable closer integration and easier automation. This API technology is backed by mature tools and a strong ecosystem.

Second is the strategic positioning of API management within all of the message flows of an organization. APIs are becoming the doorways through which all internal and external interactions of an enterprise flow. Even websites and other user interfaces rely on these APIs to carry out their back-end functions. It is easy to see how watching API traffic could enable teams to ascertain how the organization functions over time. As APIs become the mediators of all interactions, the API management solution can become a portal that shows how an organization works.

Therefore, rather than building a turnkey analytics solution, we should be thinking about making a turnkey API-driven analytics solution an integral part of API management tools. Such a solution is feasible for a couple of reasons.

To start, because API management sits at the crossroads of all communications within or without the organization, we can instrument the API management tools instead of the actual systems. This can be done once as part of the API management framework, which can be updated as needed. Then, by collecting messages that go through the APIs, we can get a full view of the organization. This centralized approach eliminates the need for an enterprise to coordinate 10 or 20 teams to add instrumentation to all of the systems. It also removes the challenge of managing the multiple formats of data collected via the system instrumentations of traditional analytics.

Instead, since all data is collected through one logical layer with the API management system, the format of the data is known. This enables the development of a turnkey API-driven analytics solution that supports common use cases, such as fraud detection, customer journey tracking, and segment analysis, among others, as out-of-the-box scenarios. A team of skilled data scientists—whether within a software vendor, systems integration firm, or enterprise development team—can invest in building complex analyses that cover most of the common use cases. The analyses for these scenarios then can then be used by multiple organizations or multiple groups within a large enterprise.

The next section describes a blueprint for a turnkey API-driven analytics solution that follows the processes here.

A blueprint for API-driven analytics

In a turnkey API-driven analytics solution, we can instrument API management tools instead of instrumenting every system or subsystem across the whole enterprise. The data collected by instrumenting all API activities can provide enough information to analyze and get a rich understanding of the organization and its inner workings. Further, updating the analytics capabilities can be achieved by updating the API management software—one system managed by a single group, rather than involving multiple systems and teams in the organization.

The following picture shows a high-level blueprint of an API-driven analytics solution that is layered on top of API management.

api driven analyticsWSO2

Layering analytics on top of API management. 

In the approach illustrated here, data collected at the API layer would include information about the following:

  • The request and response, including timestamps, headers, full message, message size, and request path URL
  • The invocation, IP address, username, and user agent
  • Processing, including time started, time ended, outcome, errors, API name, hostname, and protocol

Just using the above information, the analytics system could build a detailed picture of which users are invoking which APIs, from where, and when. That view could be further analyzed to understand the customer journey, for instance understanding what activities led the customer to buy, and to understand the loads received by an API.

However, the views listed above will be too technical for many users without one more level of mapping to business concepts. Following are some examples of such mappings:

  • In addition to knowing how many requests are received, it would be useful to know the money flows related to each request.
  • In addition to knowing just the API name, it would be useful to know which business unit the API belongs to and the average cost to serve a request.
  • In addition to knowing the customer name, it would be useful to pull in customer demographics and slice and dice the data based on demographics.

In short, to deliver more business-level insights, the data collection layer has to go beyond the obvious and collect additional information. Let’s explore two techniques for accomplishing this.

The first technique is to annotate the API definition with information about what interesting data is available inside the message content. This enables the data collection layer to automatically extract such information and send it to the analytics system. Most messages use XML or XPath, and instructions to extract information can be provided as XPath or JSON XPath expressions.

The second technique is to annotate the API definitions with details about data sets that can be joined with collected data to enable further processing. For example, a data set might provide customer demographic data that can be joined against customer names or other information, such as the business unit the API belongs to and the average cost to serve a request.

As mentioned earlier, all data is collected through one logical layer, so the format of the data is known. Therefore, a team of skilled data scientists could build complex analyses that cover most of the common use cases. For example:

  • Detailed analysis of revenue and cost contribution by different business units, APIs, business activities, different customer segments, and geographies on an ongoing basis.
  • Trend analysis and forecasting of incoming and outgoing money flows based on trends and historical data.
  • Customer journey analysis that explores how the sales pipeline converts to customers and what activities have a higher likelihood of leading to conversions.
  • Fraud detection based on overall activities as well as individual customers when they deviate from normal behavior

Implementing such solutions would enable companies to concentrate their resources—to invest their time and knowledge in delivering the best offerings and experiences—rather than having to rediscover the analyses and build them from the scratch. Turnkey analytics won’t cover all use cases, but they can add readily recognized value from day one. With key use cases covered out of the box, teams then can build their own analytics apps on top the collected data to handle edge cases. Finally, the APIs themselves can trigger actions with the support of the turnkey solution.

The proposed solution described here could be built on top of existing analytics solutions, such as MapReduce systems, machine learning frameworks, and stream processors. Rather than replacing those technologies, the solution would work with them to define data formats, provide turnkey data collection mechanisms, and deliver turnkey analytics apps that work from day one.  

Challenges of API-driven analytics

The turnkey API-driven analytics approach presented in this article is not without its challenges.

The first challenge is adding annotations to API definitions that describe how to extract interesting information from messages as part of the API development experience. It is important to make this step painless as possible. Achieving this may include providing tools to explore the messages, select a certain area for extraction, and even suggest important data points to extract.

The second challenge is implementing data extraction and data collection steps efficiently within the API gateways that would act as proxies between customers and service implementations. Since they are in the critical path of all API invocations, suboptimal implementations can drastically affect performance.

The third challenge is identifying and implementing common analytics solutions that can be built on top of data collected from API calls. This includes figuring out the best algorithms as well as the best way to represent the data and best user experiences. This is a hard problem. However, compared to status-quo, where each organization or business unit has to figure out its own analytics, the proposed approach enables the development of reusable solutions for analytics scenarios.

APIs serve as a portal that shows how an organization works, providing information about the enterprise’s operations, interactions, and business unit details, among other insights. This presents an opportunity to instrument API management tools to collect data rather than instrumenting the entire enterprise.

In turn, API management instrumentation provides an opportunity to build turnkey API-driven analytics solutions that will minimize or even eliminate the need to coordinate multiple teams by making it possible to collect data through one logical layer and provide turnkey analytics scenarios for the organization. As a result, an analytics system that is integrated and built to work closely with API management tools can drastically reduce the cost of applying analytics and make it useful from the day one.

Srinath Perera is vice president of research at WSO2. He is a scientist, software architect, author, and speaker.

New Tech Forum provides a venue to explore and discuss emerging enterprise technology in unprecedented depth and breadth. The selection is subjective, based on our pick of the technologies we believe to be important and of greatest interest to InfoWorld readers. InfoWorld does not accept marketing collateral for publication and reserves the right to edit all contributed content. Send all inquiries to newtechforum@infoworld.com.

Source: InfoWorld Big Data

IDG Contributor Network: Human data is the future of information

IDG Contributor Network: Human data is the future of information

With GDPR finally on the books, I’ve been thinking a lot about the core issues of this truly global data regulation. Last month, I dove into how anxiety about bad data hygiene can be solved with interface—building back-end data hubs and intuitive frontend to empower staffers to interact with data and solve business problems.

Ultimately, GDPR forces organizations to think about the “people data” in their systems in a humanistic way. It’s as if, after three decades of the internet and ten years of smartphones, people have said, “You can have my information, just treat me like a person.”

Defining human data

Human data can conjure images of biometrics—a heart rate during a bike ride, a fingerprint that unlocks a phone. But that data, which is easily captured and crunched, speaks only to our physicality, not to the nuanced, social aspects of humanity.

Human data, on the other hand, exists as nonnumerical, unstructured data sets. It comes from online surveys and social media posts; it says something about your personality, which is why big data sometimes struggles to analyze it.

Twitter is a good example. A single tweet generates reams of raw data—times, dates, locations—associated with the device it was typed or tapped on, the browser or app it was sent from, the servers it passes through. Those strings of letters and numbers are immutable, but they’re insignificant to the people reading and replying to the original 280 characters.

Those characters comprise only a tiny fraction of the tweet’s overall data, but they are etched in digital stone and as unique as human thought. They’re so layered with meaning and so open to interpretation that they can help start a revolution just as much as they can upend a person’s life. They beg to be respected as much as the person who created them.

The business case for human data

Viewed through this prism, human data seems like an obvious choice for a business’s focus. In today’s commercial climate, where an online retailer doesn’t profit from a customer until he or she has shopped there four times, retention and brand loyalty make the difference. What company wouldn’t want to know its customers better than they know themselves?

Yet the trend of the digital world has been to reduce people to identifiers. One strain of thought holds that people are best classified by “thing data”: what product did they buy, when did they buy it, where were they when they bought it, where did they have it shipped, and so on.

With “thing data” on hand, the inclination is to cross-reference it with “organization data,” or the process of sorting customers to dump them into various buckets. Then put it all together, run it through some “big data” algorithm, and predict what generic customer X wants to buy.

That was the siren song of the “age of big data.” But it posed two big problems. The first is that without the right systems, an organization will be lost regardless of its data volume. Skimping on a data hub that unites master data and application data is a major misstep; viewing a customer only through CRM is ineffective if the customer has also interacted with four other systems that can’t communicate with one another.

And that dovetailed with the second problem: People starting to generate so much data just going about their everyday lives—using a smartphone to send a text while sending a tweet while scheduling a meeting while liking a photo while buying a shirt while paying for a coffee while listening to music in a coffee shop on Wi-Fi in a location—that their data became indistinguishable from their human selves. And if their data was the very essence of their humanity, the organizations that captured this data would need not only to make sense of it, but to treat it like they would treat an actual human being.

Smart businesses have recognized that this new reality is the future, and they’ve gotten ahead of it. Why fuss over a regulation that at its most draconian forces you to delete every bit of a customer’s data if that capability is already part of your business model because it’s good business practice? The ability to comply with GDPR is really just a signal that a business has a clean, quality, 360-degree view of its customers—the baseline for understanding them, marketing to them, and using sophisticated Artificial intelligence and machine learning tools to achieve rational business ends that involve them, rather than just toying with their data because they can.

Human data for everyone

“Human data” isn’t just about customers but people—employees, marketers, and suppliers. Behind every application and web browser is a person interacting directly or implicitly with another person, each of whom wants a reasonable balance of security and access over their data. Above all, human data is about respecting that data has become so important to people’s livelihood—their credit scores just as much their personalities—that it shouldn’t be treated differently than they would be treated.

This article is published as part of the IDG Contributor Network. Want to Join?

Source: InfoWorld Big Data

What is TensorFlow? The machine learning library explained

What is TensorFlow? The machine learning library explained

Machine learning is a complex discipline. But implementing machine learning models is far less daunting and difficult than it used to be, thanks to machine learning frameworks—such as Google’s TensorFlow—that ease the process of acquiring data, training models, serving predictions, and refining future results.

Created by the Google Brain team, TensorFlow is an open source library for numerical computation and large-scale machine learning. TensorFlow bundles together a slew of machine learning and deep learning (aka neural networking) models and algorithms and makes them useful by way of a common metaphor. It uses Python to provide a convenient front-end API for building applications with the framework, while executing those applications in high-performance C++.

TensorFlow can train and run deep neural networks for handwritten digit classification, image recognition, word embeddings, recurrent neural networks, sequence-to-sequence models for machine translation, natural language processing, and PDE (partial differential equation) based simulations. Best of all, TensorFlow supports production prediction at scale, with the same models used for training.

How TensorFlow works

TensorFlow allows developers to create dataflow graphs—structures that describe how data moves through a graph, or a series of processing nodes. Each node in the graph represents a mathematical operation, and each connection or edge between nodes is a multidimensional data array, or tensor.

TensorFlow provides all of this for the programmer by way of the Python language. Python is easy to learn and work with, and provides convenient ways to express how high-level abstractions can be coupled together. Nodes and tensors in TensorFlow are Python objects, and TensorFlow applications are themselves Python applications.

The actual math operations, however, are not performed in Python. The libraries of transformations that are available through TensorFlow are written as high-performance C++ binaries. Python just directs traffic between the pieces, and provides high-level programming abstractions to hook them together.

TensorFlow applications can be run on most any target that’s convenient: a local machine, a cluster in the cloud, iOS and Android devices, CPUs or GPUs. If you use Google’s own cloud, you can run TensorFlow on Google’s custom TensorFlow Processing Unit (TPU) silicon for further acceleration. The resulting models created by TensorFlow, though, can be deployed on most any device where they will be used to serve predictions.

TensorFlow benefits

The single biggest benefit TensorFlow provides for machine learning development is abstraction. Instead of dealing with the nitty-gritty details of implementing algorithms, or figuring out proper ways to hitch the output of one function to the input of another, the developer can focus on the overall logic of the application. TensorFlow takes care of the details behind the scenes.

TensorFlow offers additional conveniences for developers who need to debug and gain introspection into TensorFlow apps. The eager execution mode lets you evaluate and modify each graph operation separately and transparently, instead of constructing the entire graph as a single opaque object and evaluating it all at once. The TensorBoard visualization suite lets you inspect and profile the way graphs run by way of an interactive, web-based dashboard.

And of course TensorFlow gains many advantages from the backing of an A-list commercial outfit in Google. Google has not only fueled the rapid pace of development behind the project, but created many significant offerings around TensorFlow that make it easier to deploy and easier to use: the above-mentioned TPU silicon for accelerated performance in Google’s cloud; an online hub for sharing models created with the framework; in-browser and mobile-friendly incarnations of the framework; and much more.

One caveat: Some details of TensorFlow’s implementation make it hard to obtain totally deterministic model-training results for some training jobs. Sometimes a model trained on one system will vary slightly from a model trained on another, even when they are fed the exact same data. The reasons for this are slippery—e.g., how random numbers are seeded and where, or certain non-deterministic behaviors when using GPUs). That said, it is possible to work around those issues, and TensorFlow’s team is considering more controls to affect determinism in a workflow.

TensorFlow vs. the competition

TensorFlow competes with a slew of other machine learning frameworks. PyTorch, CNTK, and MXNet are three major frameworks that address many of the same needs. Below I’ve noted where they stand out and come up short against TensorFlow.

  • PyTorch, in addition to being built with Python, and has many other similarities to TensorFlow: hardware-accelerated components under the hood, a highly interactive development model that allows for design-as-you-go work, and many useful components already included. PyTorch is generally a better choice for fast development of projects that need to be up and running in a short time, but TensorFlow wins out for larger projects and more complex workflows.

  • CNTK, the Microsoft Cognitive Toolkit, like TensorFlow uses a graph structure to describe dataflow, but focuses most on creating deep learning neural networks. CNTK handles many neural network jobs faster, and has a broader set of APIs (Python, C++, C#, Java). But CNTK isn’t currently as easy to learn or deploy as TensorFlow.

  • Apache MXNet, adopted by Amazon as the premier deep learning framework on AWS, can scale almost linearly across multiple GPUs and multiple machines. It also supports a broad range of language APIs—Python, C++, Scala, R, JavaScript, Julia, Perl, Go—although its native APIs aren’t as pleasant to work with as TensorFlow’s.

Source: InfoWorld Big Data

IDG Contributor Network: How will data intelligence transform the enterprise?

IDG Contributor Network: How will data intelligence transform the enterprise?

As long as people have been doing business they’ve been looking for ways to improve their products, fine-tune their process, and reach more customers. There have been some truly innovative techniques developed over the years. However, few have been as potentially game-changing as data intelligence. Advances in data science make it easier than ever to organize a company’s data into actionable insights.

The impact is so striking that using non-data-based methods alone is no longer enough to stay competitive. There’s too much information available for people to handle in any reasonable amount of time. Data intelligence catches that information and filters out useful data for human attention. To see this effect in action, take a look at how data intelligence outperforms traditional business practices in three common areas.

Customer segmentation and profiling

Old school

Customer segmentation is traditionally done according to demographics that are assumed to have the most significant impact on purchasing habits. These generally include things like:

  • age
  • gender
  • income
  • ZIP code
  • marital status

While they are worth considering, these demographic categories are too broad. Personalization is a huge trend in marketing; designing marketing strategies based on raw demographics can alienate potential customers and lead to underperforming campaigns.

Additionally, many businesses are more familiar with “personas” than “customer profiles.” Personas are aspirational. They’re created by marketing and sales teams as a way to outline their ideal customer in each segment. The idea is that they should shape their marketing to attract that perfect customer.

Personas use information from market research, focus groups, surveys, and similar opinion-gathering methods. This data inevitably contains assumptions about what is and isn’t relevant or what certain answers imply about a customer’s intent. It’s highly subjective. Because of this, personas are more useful as an aspirational tool than as marketing guidance.

Data science

Data intelligence allows a company to combine all their data during segmentation. They use information from marketing campaigns, past sales, external data about market conditions and customers, social media, customer loyalty program, in-store interactions, and more for a fuller picture of their customers.

Techniques like machine learning remove much of the human bias from the process, too. Intelligent customer segmentation starts with no assumptions and finds shared characteristics among customers beyond simple demographics. Demographics were mainly popular in the first place for lack of a better option. Now, marketers can sort customers by factors like hobbies, mutual interests, career, family structure, and other lifestyle details.

Customer profiles built on this type of data are grounded in reality, not ambition. They describe the customers who are already using the company and identify the things that encourage conversion and raise potential lifetime value. Companies can then use this data to guide their marketing and sales strategies.

Example: During the 2012 presidential campaign, former President Barack Obama’s campaign manager, Jim Messina, used data science to find create dynamic profiles of supporters. The deeper understanding of potential donors and volunteers helped them raise a staggering $1 billion and won the candidate the election.

Marketing campaigns

Old school

Without analytics software, marketing decisions have to be based on a combination of sales projections and past seasonal sales. Some companies use weekly sales numbers and operational figures. It’s hard to process all that data in time to be immediately useful, though, so the result is typically a shallow snapshot taken out of context.

Tracking projections can help guide overall strategy, but they inherently rely on outdated information. Opportunities might not be spotted until they’ve passed. This reduces the impact of flash sales and other time-sensitive events.

Data science

Real-time data analytics is where data science really shines. These programs combine data from multiple sources and analyze it as it’s being collected to provide immediate, timely insights based on:

  • regional sales patterns
  • inventory levels
  • local events
  • past sales history
  • seasonal factors

Streaming analytics suggests actions that meet customer demand as it rises, driving revenue and improving customer satisfaction.

Example: Dickey’s BBQ Pit centralized data analysis across its stores, processing story-by-store data every 20 minutes. The restaurant chain can now adjust promotions every 12 to 24 hours as opposed to weekly.

Logistics

Old school

Logistics is a place where data has a massive impact. It’s a highly complex discipline that’s influenced by a huge variety of factors. Some are obvious (weather, vendor readiness, seasonal events) while others are less obvious. Because individual managers decide what is and isn’t important based on their subjective experience, these less obvious variables are often overlooked.

Troubleshooting logistics issues is a headache as well. Without data intelligence, managers spend hours gathering information and analyzing it manually before they can even identify the problem, let alone resolve it. That’s a waste of valuable experienced labor that could be better used elsewhere.

Data science

Good logistics planning relies on timely information, and data intelligence methods like streaming analytics provide that information. Analyzing multiple data streams creates a real-time, evolving picture of operations with insights like:

  • accurate delivery timelines
  • best dates for an event
  • external events likely to affect plans
  • potential route hazards
  • ideal locations for warehouses or resupply stops

Processing the data and presenting it in a dynamic visual format often reveals unexpected patterns. Some inefficiencies and redundancies in processes are hard to detect in raw data. For instance, information generated naturally in one department might not be passed on, forcing other departments to recreate it. There may also be a staffing imbalance relative to customer volume at certain times of day that could have been avoided with advance warning. Whatever form these logistical issues take, data intelligence helps find a solution.

Example: For UPS, small changes in routes have huge results: saving one mile a day per driver saves the company as much as $50 million dollars every year. Since implementing the Orion route optimization system, UPS has trimmed more than 364 million miles from routes globally.

Controlling the hype

Data intelligence shouldn’t be seen as a panacea for all enterprise woes. Unrealistic expectations can kill a data science project as easily as a lack of support. Companies get caught up in the hype surrounding a new tool and expect immediate ROI. When the expected results don’t materialize, the company becomes disillusioned and labels data science a failure. This puts them at a disadvantage against their better-informed competitors.

Stay out of the hype cycle by viewing data intelligence as decision support, not a decision maker. Analytics aren’t magic; they simply provide targeted insights and suggestions that help executives shape corporate strategy. Maintaining realistic expectations about their potential is a step towards realizing lasting results from data intelligence programs.

This article is published as part of the IDG Contributor Network. Want to Join?

Source: InfoWorld Big Data