SAP adds new enterprise information management

SAP adds new enterprise information management

SAP yesterday renewed its enterprise information management (EIM) portfolio with a series of updates aimed at helping organizations better manage, govern and strategically use and control their data assets.

“By effectively managing enterprise data to deliver trusted, complete and relevant information, organizations can ensure data is always actionable to gain business insight and drive innovation,” says Philip On, vice president of Product Marketing at SAP.

The additions to the EIM portfolio are intended to provide customers with enhanced support and connectivity for big data sources, improved data stewardship and metadata management capabilities and a pay-as-you-go cloud data quality service, he adds.

The updates to the EIM portfolio include the following features:

  • SAP Data Services. Providing extended support and connectivity for integrating and loading large and diverse data types, SAP Data Services includes a data extraction capability for fast data transfer from Google BigQuery to data processing systems like Hadoop, SAP HANA Vora, SAP IQ, SAP HANA and other cloud storage. Other enhancements include optimizing data extraction from a HIVE table using Spark and new connectivity support for Amazon Redshift and Apache Cassandra.
  • SAP Information Steward. The latest version helps speed data resolution issues with better usability, policy and workflow processes. You can immediately view and share data quality scorecards across devices without having to log into the application. You can also more easily access information policies while viewing rules, scorecards, metadata and terms to immediately verify compliance. New information policy web services allow policies outside of the application to be viewed anywhere such as corporate portals. Finally, new and enhanced metadata management capabilities provide data stewards and IT users a way to quickly search metadata and conduct more meaningful metadata discovery.
  • SAP Agile Data Preparation. To improve collaboration capabilities between business users and data stewards, SAP Agile Data Preparation focuses on the bridge between agile business data mash-ups and central corporate governance. It allows you to share, export and import rules between different worksheets or between different data domains. The rules are shared through a central and managed repository as well as through the capability to import or export the rules using flat files. New data remediation capabilities were added allowing you to change the values of a given cell by just double clicking it, add a new column and populate with relevant data values, or add or remove records in a single action.
  • SAP HANA smart data integration and smart data quality. The latest release of the SAP HANA platform features new performance and connectivity functionality to deliver faster, more robust real-time replication, bulk/batch data movement, data virtualization and data quality through one common user interface.
  • SAP Data Quality Management microservices. This new cloud-based offering is available as a beta on SAP HANA Cloud Platform, developer edition. It’s a pay-as-you-go cloud-based service that ensures clean data by providing data validation and enrichment for addresses and geocodes within any application or environment.

“As organizations are moving to the cloud and digital business, the data foundation is so important,” On says. “It’s not just having the data, but having the right data. We want to give them a suite of solutions that truly allow them to deliver information excellence from the beginning to the end.”

On says SAP Data Quality Management microservices will be available later in the first quarter. The other offerings are all immediately available.

This story, “SAP adds new enterprise information management” was originally published by CIO.

Source: InfoWorld Big Data

Hadoop vendors make a jumble of security

Hadoop vendors make a jumble of security

A year ago a Deutsche Bank survey of CIOs found that “CIOs are now broadly comfortable with [Hadoop] and see it as a significant part of the future data architecture.” They’re so comfortable, in fact, that many CIOs haven’t thought to question Hadoop’s built-in security, leading Gartner analyst Merv Adrian to query, “Can it be that people believe Hadoop is secure? Because it certainly is not.”

That was then, this is now, and the primary Hadoop vendors are getting serious about security. That’s the good news. The bad, however, is that they’re approaching Hadoop security in significantly different ways, which promises to turn big data’s open source poster child into a potential pitfall for vendor lock-in.

Can’t we all get along?

That’s the conclusion reached in a Gartner research note authored by Adrian. As he writes, “Hadoop security stacks emerging from three independent distributors remain immature and are not comprehensive; they are therefore likely to create incompatible, inflexible deployments and promote vendor lock-in.” This is, of course, standard operating procedure in databases or data warehouses, but it calls into question some of the benefit of building on an open source “standard” like Hadoop.

Ironically, it’s the very openness of Hadoop that creates this proprietary potential.

It starts with the inherent insecurity of Hadoop, which has come to light with recent ransomware attacks. Hadoop hasn’t traditionally come with built-in security, yet Hadoop systems “increase utilization of file system-based data that is not otherwise protected,” as Adrian explains, allowing “new vulnerabilities [to] emerge that compromise carefully crafted data security regimes.” It gets worse.

Organizations are increasingly turning to Hadoop to create “data lakes.” Unlike databases, which Adrian says tend to contain “known data that conforms to predetermined policies about quality, ownership, and standards,” data lakes encourage data of indeterminate quality or provenance. Though the Hadoop community has promising projects like Apache Eagle (which uses machine intelligence to identify security threats to Hadoop clusters), the Hadoop community has yet to offer a unified solution to lock down such data and, worse, is offering a mishmash of competing alternatives, as Adrian describes:

Big data security, in short, is a big mess.

Love that lock-in

The specter of lock-in is real, but is it scary? I’ve argued before that lock-in is a fact of enterprise IT, made no better (or worse) by open source … or cloud or any other trend in IT. Once an enterprise has invested money, people, and other resources into making a system work, it’s effectively locked in.

Still, there’s arguably more at stake when a company puts petabytes of data into a Hadoop data lake versus running an open source content management system or even an operating system. The heart of any business is its data, and getting boxed into a particular Hadoop vendor because an enterprise becomes dependent on its particular approach to securing Hadoop clusters seems like a big deal.

But is it really?

Oracle, after all, makes billions of dollars “locking in” customers to its very proprietary database, so much so that it had double the market share (41.6 percent) of its nearest competitor (Microsoft at 19.4 percent) as of April 2016, according to Gartner’s research. If enterprises are worried about lock-in, they have a weird way of showing it.

For me the bigger issue isn’t lock-in, but rather that the competing approaches to Hadoop security may actually yield poorer security, at least in the short term. The enterprises that deploy more than one Hadoop stack (a common occurrence) will need to juggle the conflicting security approaches and almost certainly leave holes. Those that standardize on one vendor will be stuck with incomplete security solutions.

Over time, this will improve. There’s simply too much money at stake for the on-prem and cloud-based Hadoop vendors. But for the moment, enterprises should continue to worry about Hadoop security.

Source: InfoWorld Big Data

Apache Eagle keeps an eye on big data usage

Apache Eagle keeps an eye on big data usage

Apache Eagle, originally developed at eBay and then donated to the Apache Software Foundation, fills big data security niche that remains thinly populated, if not bare: It sniffs out possible security and performance issues with big data frameworks.

To do this, Eagle uses other Apache open source components, such as Kafka, Spark, and Storm, to generate and analyze machine learning models from the behavioral data of big data clusters.

Looking in from the inside

Data for Eagle can come from activity logs for various data source (HDFS, Hive, MapR FS, Cassandra, etc.) or from performance metrics harvested directly from frameworks like Spark. The data can then be piped by the Kafka streaming framework into a real-time detection system that’s built with Apache Storm, or into a model-training system built on Apache Spark. The former’s for generating alerts and reports based on existing policies; the latter is for creating machine learning models to drive new policies.

This emphasis on real-time behavior tops the list of “key qualities” in the documentation for Eagle. It’s followed by “scalability,” “metadata driven” (meaning changes to policies are deployed automatically when their metadata is changed), and “extensibility.” This last means the data sources, alerting systems, and policy engines used by Eagle are supplied by plugins and aren’t limited to what’s in the box.

Because Eagle’s been put together from existing parts of the Hadoop world, it has two theoretical advantages. One, there’s less reinvention of the wheel. Two, those who already have experience with the pieces in question will have a leg up.

What are my people up to?

Aside from the above-mentioned use cases like analyzing job performance and monitoring for anomalous behavior, Eagle can also analyze user behaviors. This isn’t about, say, analyzing data from a web application to learn about the public users of that app, but rather the users of the big data framework itself — the folks building and managing the Hadoop or Spark back end. An example of how to run such analysis is included, and it could be deployed as-is or modified.

Eagle also allows application data access to be classified according to levels of sensitivity. Only HDFS, Hive, and HBase applications can make use of this feature right now, but its interaction with them provides a model for how other data sources could also be classified.

Let’s keep this under control

Because big data frameworks are fast-moving creations, it’s been tough to build reliable security around them. Eagle’s premise is that it can provide policy-based analysis and alerting as a possible complement to other projects like Apache Ranger. Ranger provides authentication and access control across Hadoop and its related technologies; Eagle gives you some idea of what people are doing once they’re allowed inside.

The biggest question hovering over Eagle’s future — yes, even this early on — is to what degree Hadoop vendors will elegantly roll it into their existing distributions, or use their own security offerings. Data security and governance have long been one of the missing pieces that commercial offerings could compete on.

Source: InfoWorld Big Data

IDG Contributor Network: Getting off the data treadmill

IDG Contributor Network: Getting off the data treadmill

Most companies start their data journey the same way: with Excel. People who are deeply familiar with the business start collecting some basic data, slicing and dicing it, and trying to get a handle on what’s happening.

The next place they go, especially now, with the advent of SaaS tools that aid in everything from resource planning to sales tracking to email marketing, is into the analytic tools that come packaged with their SaaS tools.

These tools provide basic analytic functions, and can give a window into what’s happening in at least one slice of the business. But drawing connections between those slices (joining finance data with marketing data, or sales with customer service) is where the real value lies. And that’s exactly where these department-specific tools fall down.

So when you talk to people in that second phase, understandably, they’re looking forward to the day when all of their data automatically flows into one place.. No more manual, laborious hours spent combining data. Just one place to look and see exactly what’s happening in the business.

Except

Once you give people a taste of the data and they can see what’s happening, naturally, their very next question is, “Well, why did that happen?”

How things usually work

And that’s where things break down. For most of the history of business intelligence, the way you answered “why” questions was to extract the relevant data from that beautiful centralized tool and send it off to an analyst. They would load the data back into a workbook, start from scratch on a new report, and you’d wait.

By the time you got your answer, it was usually too late to use that knowledge in making your decision.

The whole thing is kind of silly, though — you’d successfully gotten rid of a manual, laborious process and replaced it with one that is, well, manual and laborious. You thought you were moving forward, but it turns out you were just on a treadmill.

To sketch it out, here’s what that looks like:

img1Daniel Mintz

Another path

Recently though, more and more businesses are realizing that there’s another way: With the right tools, you can put the means to answer why questions in the hands of the people who can (and will) take action based on those answers.

In the old world, you’d find out in February that January leads were down, and wait until March for the analysis that reveals that — d’oh! — the webform wasn’t working on mobile. In the new world, you can get an automated alert about the drop-off in the first week of the year. You can drill into the relevant data immediately by device type, realize that the drop-off only affects mobile, surface the bug, and get it fixed that afternoon.

That’s the real value that most businesses aren’t realizing from their data. It’s much less about incorporating the latest machine learning algorithm that delivers a 3% improvement in behavioral prediction, and more about the seemingly simple task of putting the right information in front of the right person at the right time.

The task isn’t simple (especially considering the mountains of data most companies are sitting on). But the good news is that it is achievable and it doesn’t take a room full of Ph.D’s or millions of dollars in specialized software.

What it does take is focus, and a commitment to being data-driven.

Luckily, it’s worth it. The payoff of facilitating this kind of exploration is enormous. It can be the difference between making the right decision and the wrong one — hundreds of times a month — all across your company.

img2Daniel Mintz

So if you find yourself stuck on the treadmill, try stepping off. I think you’ll like where the path takes you.

This article is published as part of the IDG Contributor Network. Want to Join?

Source: InfoWorld Big Data

InfoWorld's 2017 Technology of the Year Award winners

InfoWorld's 2017 Technology of the Year Award winners

Imagine if the files, processes, and events in your entire network of Windows, MacOS, and Linux endpoints were recorded in a database in real time. Finding malicious processes, software vulnerabilities, and other evil artifacts would be as easy as asking the database. That’s the power of OSquery, a Facebook open source project that makes sifting through system and process information to uncover security issues as simple as writing a SQL query.

Facebook ported OSquery to Windows in 2016, finally letting administrators use the powerful open source endpoint security tool on all three major platforms. On each Linux, MacOS, and Windows system, OSquery creates various tables containing operating system information such as running processes, loaded kernel modules, open network connections, browser plugins, hardware events, and file hashes. When administrators need answers, they can ask the infrastructure.

The query language is SQL-like. For example, the following query will return malicious processes kicked off by malware that has deleted itself from disk:

SELECT name, path, pid FROM processes WHERE on_disk = 0;

This ability has been available to Linux and MacOS administrators since 2014 —Windows administrators are only now coming to the table.

Porting OSquery from Linux to Windows was no easy feat. Some creative engineering was needed to overcome certain technical challenges, such as reimplementing the processes table so that existing Windows Management Instrumentation (WMI) functionality could be used to retrieve the list of running processes. (Trail of Bits, a security consultancy that worked on the project, shares the details in its blog.)  

Administrators don’t need to rely on complicated manual steps to perform incident response, diagnose systems operations problems, and handle security maintenance for Windows systems. With OSquery, it’s all in the database.

— Fahmida Y. Rashid

This article appears to continue on subsequent pages which we could not extract

Source: InfoWorld Big Data

Tap the power of graph databases with IBM Graph

Tap the power of graph databases with IBM Graph

Natural relationships between data contain a gold mine of insights for business users. Unfortunately, traditional databases have long stored data in ways that break these relationships, hiding what could be valuable insight. Although databases that focus on the relational aspect of data analytics abound, few are as effective at revealing the hidden valuable insights as a graph database.

A graph database is designed from the ground up to help the user understand and extrapolate nuanced insight from large, complex networks of interrelated data. Highly visual graph databases represent discrete data points as “vertices” or “nodes.” The relationships between these vertices are depicted as connections called “edges.” Metadata, or “properties” of vertices and edges, are also stored within the graph database to provide more in-depth knowledge of each object. Traversal allows users to move between all the data points and find the specific insights the user seeks.

To better explain how graph databases work, I will use IBM Graph, a technology that I helped to build and am excited to teach new users about. Let’s dive in.

Intro to IBM Graph

Based on the Apache TinkerPop framework for building high-performance graph applications, IBM Graph is built to enable and work with powerful applications through a fully managed graph database service. In turn, the service provides users with simplified HTTP APIs, an Apache TinkerPop v3 compatible API, and the full Apache TinkerPop v3 query language. The goal of this type of database is to make it easier to discover and explore the relationships in a property graph with index-free adjacency using nodes, edges, and properties. In other words, every element in the graph is directly connected to adjoining elements, eliminating the need for index lookups to traverse a graph. 

Through the graph-based NoSQL store it provides, IBM Graph creates rich representations of data in an easily digestible manner. If you can whiteboard it, you can graph it. All team members, from the developer to the business analyst, can contribute to the process.

The flexibility and ease of use offered by a graph database such as IBM Graph mean that analyzing complex relationships is no longer a daunting task. A graph database is the right tool for a time when data is generated at exponentially high rates amid new applications and services. A graph database can be leveraged to produce results for recommendations, social networks, efficient routes between locations or items, fraud detection, and more. It efficiently allows users to do the following:

  • Analyze how things are interconnected
  • Analyze data to follow the relationships between people, products, and so on
  • Process large amounts of raw data and generate results into a graph
  • Work with data that involves complex relationships and dynamic schema
  • Address constantly changing business requirements during iterative development cycles

How a graph database works

Schema with indexes. Graph databases can either leverage a schema or not. IBM Graph works with a schema to create indexes that are used for querying data. The schema defines the data types for the properties that will be employed and allows for the creation of indexes for the properties. In IBM Graph, indexes are required for the first properties accessed in the query. The schema is best done beforehand (although it can be appended later) in order to ensure that the vertices and edges introduced along the way can work as intended.

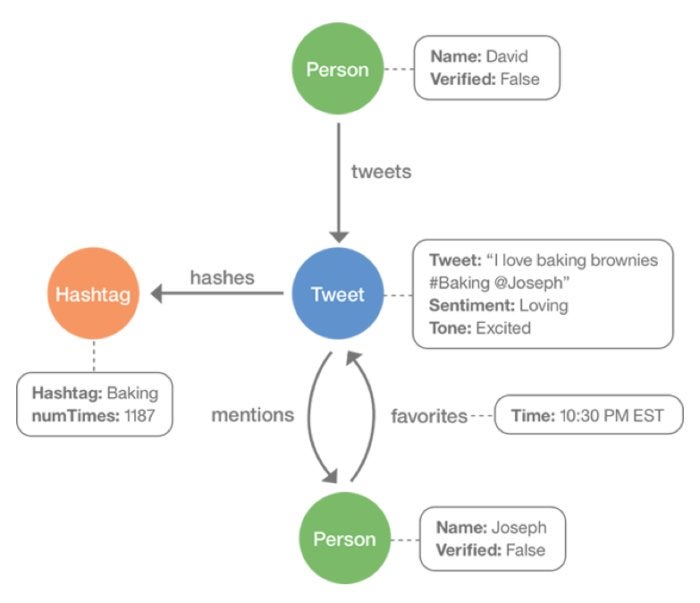
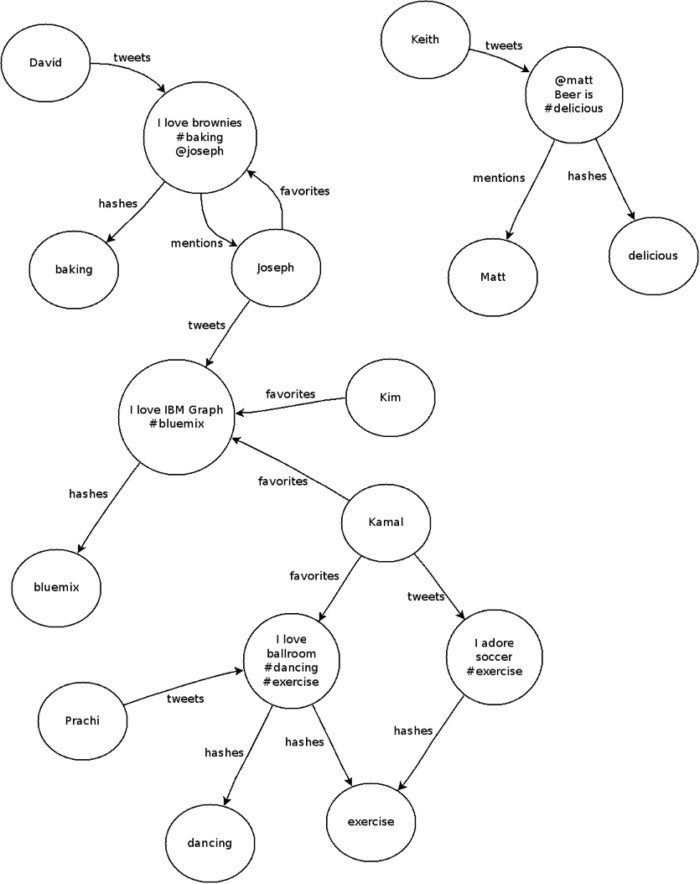
A schema should define properties, labels, and indexes for a graph. For instance, if analyzing Twitter data, the data would be outlined as person, hashtag, and tweet vertices, and the connections between them are mentions, hashes, tweets, and favorites. Indices are also created to query schemas.

graph database graphIBM

Loading data. Although a bulk upload endpoint is available, the Gremlin endpoint is the recommended method for uploading data to the service. This is because you can upload as much data as you want via the Gremlin endpoint. Moreover, the service automatically assigns IDs to graph elements when you use the bulk upload endpoint, preventing connections from being made between nodes and edges from separate bulk uploads. The response to your upload should let you know if there was an error in the Gremlin script and return the last expression on your script. A successful input should result in something like this:

graph database graphIBM

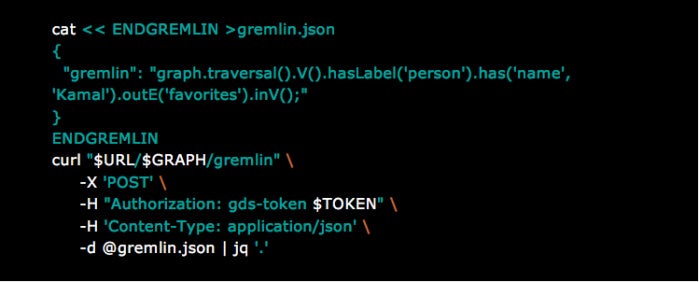
Querying data. IBM Graph provides various API endpoints for querying data. For example, the /vertices and /edges endpoints can be used to query graph elements by properties or label. But these endpoints should not be employed for production queries. Instead, go with the /Gremlin endpoint, which can work for more complex queries or for performing multiple queries in a single request. Here’s an example of a query that returns the tweets favorited by user Kamal on Twitter:

ibm graph query 1IBM

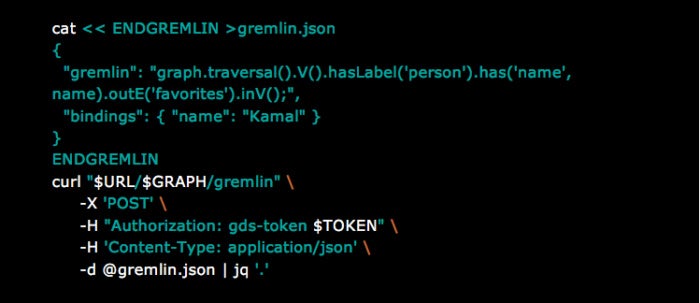
To improve query performance and prevent Gremlin query code from being compiled every time, use bindings. Bindings allow you to keep the script the same (cached) while varying the data it uses with every call. For example, if there is a query that retrieves a particular group of discrete data points, you can assign a name in a binding. The binding can then reduce the time it takes to run similar queries, as the code only has to be compiled a single time. Below is a modified version of the above query that uses binding:

ibm graph query 2IBM

It is important to note there is no direct access to the Gremlin binary protocol. Instead, you interact with the HTTP API. If you can make a Curl request or an HTTP request, you can still manipulate the graph. You make the request to endpoints.

For running the code examples in this article locally on your own machine, you need bash, curl, and jq.

Configuring applications for IBM Graph

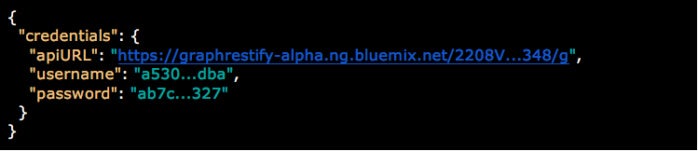
When creating an instance of IBM Graph service, the necessary details for your application to interact with the service are provided in JSON format.

ibm graph jsonIBM

Service instances can typically be used by one or more applications and can be accessed via IBM Bluemix or outside it. If it’s a Bluemix application, the service is tied to the credentials used to create it, which can be found in the VCAP_SERVICES environment variable.

Remember to make sure the application is configured to use:

  • IBM Graph endpoints that are identified by the apiURL value
  • The service instance username that is identified by the username value
  • The service instance password that is identified by the password value

In the documentation, Curl examples use $username, $password, and $apiURL when referring to the fields in the service credentials.

Bluemix and IBM Graph

IBM Graph is a service provided via IBM’s Bluemix—a platform as a service that supports several programming languages and services along with integrated devops to build, run, deploy, and manage cloud-based applications. There are three steps to using a Bluemix service like IBM Graph:

  • Create a service instance in Bluemix by requesting a new service instance. Alternatively, when using the command-line interface, go with IBM Graph as the service name and Standard as the service plan.
  • (Optional) Identify the application that will use the service. If it’s a Bluemix application, you can identify it when you create a service instance. If external, the service can remain unbound.
  • Write code in your application that interacts with the service.

Ultimately, the best way to learn a new tool like IBM Graph is to build an application that solves a real-world problem. Graph databases are used for social graphs, fraud detection, and recommendation engines, and there are simplified versions of these applications that you can build based on pre-existing data sets that are open for use (like census data). One demonstration that is simple, yet entertaining, is to test a graph with a six-degrees-of-separation-type example. Take a data set that interests you, and explore new ways to find previously hidden connections in your data.

New Tech Forum provides a venue to explore and discuss emerging enterprise technology in unprecedented depth and breadth. The selection is subjective, based on our pick of the technologies we believe to be important and of greatest interest to InfoWorld readers. InfoWorld does not accept marketing collateral for publication and reserves the right to edit all contributed content. Send all inquiries to newtechforum@infoworld.com.

Source: InfoWorld Big Data

Review: Scikit-learn shines for simpler machine learning

Review: Scikit-learn shines for simpler machine learning

Scikits are Python-based scientific toolboxes built around SciPy, the Python library for scientific computing. Scikit-learn is an open source project focused on machine learning: classification, regression, clustering, dimensionality reduction, model selection, and preprocessing. It’s a fairly conservative project that’s pretty careful about avoiding scope creep and jumping on unproven algorithms, for reasons of maintainability and limited developer resources. On the other hand, it has quite a nice selection of solid algorithms, and it uses Cython (the Python-to-C compiler) for functions that need to be fast, such as inner loops.

Among the areas Scikit-learn does not cover are deep learning, reinforcement learning, graphical models, and sequence prediction. It is defined as being in and for Python, so it doesn’t have APIs for other languages. Scikit-learn doesn’t support PyPy, the fast just-in-time compiling Python implementation because its dependencies NumPy and SciPy don’t fully support PyPy.

Source: InfoWorld Big Data

CallidusCloud CPQ And Clicktools Earn Servicemax Certification

CallidusCloud CPQ And Clicktools Earn Servicemax Certification

Callidus Software Inc. has announced the integrations of its award-winning configure price quote (CPQ) and Clicktools feedback solutions with ServiceMax’s leading cloud-based field service management platform.

ServiceMax customers, who manage all aspects of the field service process, including work orders, parts management, entitlements and dispatch, can now seamlessly employ CallidusCloud’s quote generation capabilities and the ability to collect customer feedback from within the ServiceMax platform. The combination simplifies and removes previously manual CPQ processes to better tackle new business opportunities, which frequently arise during the service process.

The combination enables field service reps to generate value-rich quotes and proposals while they’re on-site with customers. Once the quote has been generated, customer feedback can be collected to ensure an excellent customer experience and to help improve future interactions.

“To meet customer expectations in the Internet of Things era, it’s vital to automate as many steps in the sales process as possible,” said Giles House, chief marketing officer at CallidusCloud. “Customers want to complete transactions faster and more accurately, especially when they’re face to face with field service representatives. Giving service reps the power to efficiently complete transactions will help ServiceMax customers make more money faster.”

“Price automation used to be one more hurdle for our customers to provide a seamless service experience,” said Jonathan Skelding, vice president of global alliances at ServiceMax. “Integrating CallidusCloud’s technology into our platform has facilitated a faster, more intuitive quote-automation process — and as a result, it’s empowered technicians to provide a flawless field service experience. When used in an Internet of Things environment such as our Connected Field Service platform, imagine a connected machine initiating a parts and labor quote which, once authorized, creates the work order and schedules the technician.”

CPQ and the Clicktools platform are delivered as part of CallidusCloud’s Lead to Money suite, a SaaS suite designed to help businesses drive enterprise engagement, sales performance management and sales effectiveness throughout the sales cycle to close bigger deals, faster.

Source: CloudStrategyMag

CloudGenix Partners With Converged Network Services Group

CloudGenix Partners With Converged Network Services Group

CloudGenix, Inc. has announced it has entered into a master agent agreement with Converged Network Services Group (CNSG), the premier Master Distributor for connectivity, cloud, and cloud enablement. With this partnership, CloudGenix will accelerate its business development, while CNSG will add the CloudGenix Instant-On Networks (ION) product family to its portfolio of solutions. With CloudGenix ION, CNSG and its partners can now provide customers with the best solutions for their connectivity needs, independent of carriers and connectivity transports.

CNSG, a solutions provider for end-to-end telecommunications services, has a decade-long track record of helping businesses manage their communications infrastructure. Together, CNSG and CloudGenix will provide customers with not only a best-of-breed connectivity solution, but will also deliver SLAs for cloud applications such as Office365, AWS, Azure, Unified Communications, and VoIP. CloudGenix ION eliminates complex routing protocols and hardware routers, enabling direct setup of business rules and app SLAs, while also reducing WAN costs by 50% to 70%. All network and app flows are stored in a centralized database, providing customer access to native, actionable application and network insights. CloudGenix uniquely delivers single-sided, per-app controls and SLAs for cloud apps.

“CNSG is committed to working with only the best-of-breed technology suppliers to deliver the highest quality solutions for our partners and their customers,” said Randy Friedberg, vice president of business development at CNSG. “Our alliance with CloudGenix reflects this mission, and ensures our product portfolio continues to align with customers’ needs for cost savings and unmatched application performance. CloudGenix uniquely offers provider-agnostic SD-WAN solutions and provides unmatched support for our partners.”

“This agreement is a win all around: CNSG benefits from leading-edge SD-WAN product offerings for its customers that enables its telco aggregation service, CloudGenix is partnering with a leader in the industry, while customers benefit with cost savings, streamlined business processes and a solution that will take them into the future,” said Kumar Ramachandran, CEO of CloudGenix. “It’s a strong strategic fit that maximizes the strengths of both companies.”

Register here for a February 18, 2017 webinar featuring CNSG and CloudGenix, which will discuss the successes companies are realizing with CloudGenix SD-WAN.

Source: CloudStrategyMag

Fusion Wins Three Year, $350,000 Contract

Fusion Wins Three Year, 0,000 Contract

Fusion has announced that it has signed a three year, $350,000 cloud solutions contract with a major, multi-site radiology center headquartered in the Midwest. The win demonstrates Fusion’s increasing success in the health care vertical. Fusion’s specialized solutions are winning growing acceptance among health care providers who cite Fusion’s comprehensive understanding of the industry’s needs and its professional expertise in delivering effective solutions that solve its unique problems.

The radiology center has continuously evolved its imaging technology for over seventy years, providing expert diagnoses and treatment to patients referred by multiple hospitals and ambulatory care centers in the region. It was impressed with Fusion’s flexibility and agility in customizing solutions to meet the industry’s demanding compliance requirements.

The center also noted that Fusion’s feature-rich cloud communications solutions are provided over the company’s own advanced, yet proven cloud services platform, allowing for the seamless, cost-effective integration of additional cloud services. Citing quality and business continuity concerns, the center was further impressed that Fusion’s solutions are integrated with secure, diverse connections to the cloud over its robust, geo-redundant national network, with end to end quality of service guarantees and business continuity built in.

Fusion’s single source cloud solutions offer the radiology center a single point of contact under one contract for integrated services, eliminating the need to manage multiple vendors, and optimizing efficiency with shared, burstable resources across the enterprise.

“We appreciate the healthcare’s industry’s increasing confidence in us, and we are pleased to have been selected to help the center advance its technology investments with our cost-effective single source cloud solutions. Fusion is committed to providing healthcare institutions with the solutions they need to provide the highest levels of care professionally, efficiently and compassionately,” said Russell P. Markman, Fusion’s president of business services.

Source: CloudStrategyMag