MIT-Stanford project uses LLVM to break big data bottlenecks

MIT-Stanford project uses LLVM to break big data bottlenecks

The more cores you can use, the better — especially with big data. But the easier a big data framework is to work with, the harder it is for the resulting pipelines, such as TensorFlow plus Apache Spark, to run in parallel as a single unit.

Researchers from MIT CSAIL, the home of envelope-pushing big data acceleration projects like Milk and Tapir, have paired with the Stanford InfoLab to create a possible solution. Written in the Rust language, Weld generates code for an entire data analysis workflow that runs efficiently in parallel using the LLVM compiler framework.

The group describes Weld as a “common runtime for data analytics” that takes the disjointed pieces of a modern data processing stack and optimizes them in concert. Each individual piece runs fast, but “data movement across the [different] functions can dominate the execution time.”

In other words, the pipeline spends more time moving data back and forth between pieces than actually doing work on it. Weld creates a runtime that each library can plug into, providing a common method to run key data across the pipeline that needs parallelization and optimization.

Frameworks don’t generate code for the runtime themselves. Instead, they call Weld via an API that describes what kind of work is being done. Weld then uses LLVM to generate code that automatically includes optimizations like multithreading or the Intel AV2 processor extensions for high-speed vector math.

InfoLab put together preliminary benchmarks comparing the native versions of Spark SQL, NumPy, TensorFlow, and the Python math-and-stats framework Pandas with their Weld-accelerated counterparts. The most dramatic speedups came with the NumPy-plus-Pandas benchmark, where the work could be amplified “by up to two orders of magnitude” when parallelized across 12 cores.

Those familiar with Pandas and want to take Weld for a spin can check out Grizzly, a custom implementation of Weld with Pandas.

It’s not the pipeline, it’s the pieces

Weld’s approach comes out of what its creators believe is a fundamental problem with the current state of big data processing frameworks. The individual pieces aren’t slow; most of the bottlenecks arise from having to hook them together in the first place.

Building a new pipeline integrated from the inside out isn’t the answer, either. People want to use existing libraries, like Spark and TensorFlow. Dumping that means getting rid of a culture of software already built around those products.

Instead, Weld proposes making changes to the internals of those libraries, so they can work with the Weld runtime. Application code that, say, uses Spark wouldn’t have to change at all. Thus, the burden of the work would fall on the people best suited to making those changes — the library and framework maintainers — and not on those constructing apps from those pieces.

Weld also shows that LLVM is a go-to technology for systems that generate code on demand for specific applications, instead of forcing developers to hand-roll custom optimizations. MIT’s previous project, Tapir, used a modified version of LLVM to automatically generate code that can run in parallel across multiple cores.

Another cutting-edge aspect to Weld: it was written in Rust, Mozilla’s language for fast, safe software development. Despite its relative youth, Rust has an active and growing community of professional developers frustrated with having to compromise safety for speed or vice versa. There’s been talk of rewriting existing applications in Rust, but it’s tough to fight the inertia. Greenfield efforts like Weld, with no existing dependencies, are likely to become the standard-bearers for the language as it matures.

Source: InfoWorld Big Data

Fujitsu Develops Database Integration Technology to Accelerate IoT Data Analysis

Fujitsu Develops Database Integration Technology to Accelerate IoT Data Analysis

Fujitsu Laboratories Ltd. has announced the development of technology to integrate and rapidly analyze NoSQL databases, used for accumulating large volumes of unstructured IoT data, with relational databases, used for data analysis for mission-critical enterprise systems.

NoSQL databases are used to store large volumes of data, such as IoT data output from various IoT devices in a variety of structures. However, due to the time required for structural conversion of large volumes of unstructured IoT data, there was an issue with the processing time of analysis involving data across NoSQL and relational databases.

Now Fujitsu Laboratories has developed technology that optimizes data conversion and reduces the amount of data transfer by analyzing SQL queries to seamlessly access relational databases and NoSQL databases, as well as a technology that automatically partitions the data and efficiently distributes execution on Apache Spark(1), a distributed parallel execution platform, enabling rapid analysis integrating NoSQL databases to relational databases.

When this newly developed technology was implemented in PostgreSQL(2), an open source relational database, and its performance was evaluated using open source MongoDB(3) as the NoSQL database, query processing was accelerated by 4.5 times due to the data conversion optimization and data transfer reduction technology. In addition, acceleration proportional to the number of nodes was achieved with the efficient distributed execution technology on Apache Spark.

With this technology, a retail store, for example, could continually roll out a variety of IoT devices in order to understand information such as customers’ in-store movements and actions, enabling the store to quickly try new analyses relating this information with data from existing mission-critical systems. This would contribute to the implementation of one-to-one marketing strategies that offer products and services suited for each customer.

Details of this technology were announced at the 9th Forum on Data Engineering and Information Management (DEIM2017), which was held in Takayama, Gifu, Japan, March 6-8.

Development Background

In recent years, IoT and sensor technology are improving day by day, enabling the collection of new information that was previously difficult to obtain. It is expected that connecting this new data with data in existing mission-critical and information systems will enable analyses on a number of fronts that were previously impossible.

For example, in a retail store, it is now becoming possible to obtain a wide variety of IoT data, such as understanding where customers are lingering in the store by analyzing the signal strength of the Wi-Fi on the customers’ mobile devices, or understanding both detailed actions, such as which products the customers looked at and picked up, and individual characteristics, such as age, gender, and route through the store, by analyzing image data from surveillance cameras. By properly combining this data with existing business data, such as goods purchased and revenue data, and using the result, it is expected that businesses will be able to implement one-to-one marketing strategies that offer products and services suited for each customer.

Issues

When analyzing queries that span relational and NoSQL databases, it is necessary to have a predefined data format for converting the unstructured data stored in the NoSQL database into structured data that can be handled by the relational database in order to perform fast data conversion and analysis processing. However, as the use of IoT data has grown, it has been difficult to define formats in advance, because new information for analysis is often being added, such as from added sensors, or from existing sensors and cameras receiving software updates to provide more data, for example, on customers’ gazes, actions, and emotions. At the same time, data analysts have been looking for methods that do not require predefined data formats, in order to quickly try new analyses. If, however, a format cannot be defined in advance, the conversion processing overhead is very significant when the database is queried, creating issues with longer processing times when undertaking an analysis.

About the Technology

Now Fujitsu Laboratories has developed technology that can quickly run a seamless analysis spanning relational and NoSQL databases without a predefined data format, as well as technology that accelerates analysis using Apache Spark clusters as a distributed parallel platform. In addition, Fujitsu Laboratories implemented its newly developed technology in PostgreSQL, and evaluated its performance using MongoDB databases storing unstructured data in JSON(4) format as the NoSQL databases.

Details of the technology are as follows:

  • Data Conversion Optimization Technology
    This technology analyzes database queries (SQL queries) that include access to data in a NoSQL database to extract the portions that specify the necessary fields and their data type, and identify the data format necessary to convert the data. The query is then optimized based on these results, and overhead is reduced through bulk conversion of the NoSQL data, providing performance equivalent to existing processing with a predefined data format.
  • Technology to Reduce the Amount of Data Transferred from NoSQL Databases
    Fujitsu Laboratories developed technology that migrates some of the processing, such as filtering, from the PostgreSQL side to the NoSQL side by analyzing the database query. With this technology, the amount of data transferred from the NoSQL data source is minimized, accelerating the process.
  • Technology to Automatically Partition Data for Distributed Processing
    Fujitsu Laboratories developed technology for efficient distributed execution of queries across multiple relational databases and NoSQL databases on Apache Spark. It automatically determines the optimal data partitioning that avoids unbalanced load across the Apache Spark nodes, based on information such as the data’s placement location in each database’s storage.

Effects

Fujitsu Laboratories implemented this newly developed technology in PostgreSQL, and evaluated performance using MongoDB as the NoSQL database. When evaluated using TPC-H benchmark queries that evaluate the performance of decision support systems, application of the first two technologies accelerated overall processing time by 4.5 times that of existing technology. In addition, using the third technology to perform this evaluation on an Apache Spark cluster with four nodes, a performance improvement of 3.6 times that of one node was achieved.

Using this newly developed technology, it is now possible to efficiently access IoT data, such as sensor data, through an SQL interface common throughout the enterprise field, which can flexibly support frequent format changes in IoT data, enabling fast processing of analyses including IoT data.

Source: CloudStrategyMag

Woolpert Earns Google Cloud 2016 Fastest Growing Company Award

Woolpert Earns Google Cloud 2016 Fastest Growing Company Award

Woolpert has been awarded the Google Cloud 2016 Fastest Growing Company Award for Maps Customer Success for North America. This award recognizes Woolpert for its demonstrated sales, marketing, technical, and support excellence to help customers of all sizes transform their businesses and solve a wide range challenges with the adoption of Maps.

Woolpert helps customers navigate the Google Maps for Work licensing process and advises them on the proper implementation of the Google Maps API within their Cloud solutions.

The national architecture, engineering and geospatial (AEG) firm saw its Google sales grow 250% in 2016, as compared to 2015. The firm’s sales were $3.25 million for its Google division and just shy of $150 million overall last year.

Woolpert, which has been a Google for Work Partner since March 2015 and a Google for Work Premier Partner since last summer, also was named a Premier Partner in the Google Cloud Program for 2017.

Jon Downey, director of the Google Geospatial Sales Team at Woolpert, said he is honored by this recognition and excited to see dynamic growth.

“This award represents our continued commitment to our Google partnership, and our ability to steadily grow in this market,” Downey said. “What sets Woolpert apart in the Google Cloud ecosystem is that approximately half of our firm’s business is geospatial, so this extension of our work makes sense. We’re not a sales organization and we’re not here to push software. We’re here to help.”

This extensive geospatial background enables Woolpert to add value and dimension to its Google Cloud services.

“We don’t just have the knowledge related to the Google data and deliverables, but we have a professional services staff capable of elevating that data,” he said. “We’re able to offer consultation on these services and that takes the relationship a step further, benefitting all involved.”

Bertrand Yansouni, vice president of global partner sales and strategic alliances, Google Cloud, said partners are vital contributors to Google Cloud’s growing ecosystem.

“Partners help us meet the needs of a diverse range of customers, from up-and-coming startups to Fortune 500 companies,” Yansouni said. “We are proud to provide this recognition to Woolpert, who has consistently demonstrated customer success across Maps.”

Source: CloudStrategyMag

Interoute Launches Managed Container Platform At Cloud Expo Europe

Interoute Launches Managed Container Platform At Cloud Expo Europe

Interoute will announce the integration of its global cloud infrastructure platform with Rancher Labs’ container management platform, Rancher, at Cloud Expo 2017. This new innovative approach enables enterprises to accelerate their digital transformation and infrastructure investments.

The advent of containers has revolutionised the way enterprises can build, and deploy software applications, bringing greater agility, quicker deployment times and lower operational costs. In the past, enterprise operations and infrastructure teams building new applications and software services had to manage all cloud infrastructure building blocks (the virtual server, OS, and application libraries) necessary to create their application development environment. Using a container based approach enterprise developers can now focus on writing applications and deploying the code straight into a container. The container is then deployed across the underling Interoute cloud infrastructure dramatically improving the time to develop and launch new applications and software.

The Interoute Container platform is part of the Interoute Enterprise Digital Platform, a secure global Infrastructure that combines a Software Defined Core Network integrated into a global mesh of 17 cloud zones, to optimise applications and services. Interoute makes it possible for organisations to integrate legacy, third party and digital IT environments onto single, secure, privately-connected global cloud infrastructure, creating the foundation for Enterprise Digital Transformation.

By integrating Rancher software, Interoute is now able to provide access to a full set of orchestration and infrastructure services for containers, enabling users to deploy containers in any of Interoute’s 17 cloud zones across the world. Rancher is an open-source container management platform that makes it simple to deploy and manage containers in production.

“Enterprises developing and building apps in the cloud and those on a path to Digital Transformation need Digital ICT Infrastructure that allows them to build, test and deploy faster than ever before. The integration of Rancher software with Interoute Digital Platform gives developers access to a managed container platform, that sits on a global privately networked cloud, enabling true distributed computing,” said Matthew Finnie, Interoute CTO.

“We’re thrilled to partner with Interoute and provide users of the Interoute Enterprise Digital Platform with a complete and turn-key container management platform. We look forward to seeing those users accelerate all aspects of their software development pipeline, from writing and testing code to running complex microservices-based applications,” said Louise Westoby, VP of marketing, Rancher Labs.

Source: CloudStrategyMag

CloudVelox Releases One Hybrid Cloud™ 4.0

CloudVelox Releases One Hybrid Cloud™ 4.0

CloudVelox has announced new enterprise-grade automated cloud workload mobility and optimization capabilities with enhanced management and control features for its One Hybrid Cloud™ (OHC) software. Through automation, OHC accelerates workload mobility and optimization in the cloud by matching data center environments with optimal cloud services to deliver cost savings or improved application performance, without requiring specialized cloud skills. New features for cloud optimization include: application-centric instance tagging, placement groups, multiple security groups, Identity and Access Management (IAM) roles. New features for managing workload mobility include comprehensive system reporting and alerts for the successful completion of workload migrations to the cloud. With the new powerful suite of OHC features, enterprises are able to accelerate time to value, are further equipped to meet regulatory and compliance requirements and reduce IT effort while enhancing system visibility, management and control.

According to an IDC study1, nearly 68 percent of organizations are using some form of cloud to help drive business outcomes; however, only three percent have optimized cloud strategies in place today. Businesses are challenged by unexpected cloud costs, the complexity of mapping security and data policies from the data center to the cloud, a scarcity of skilled cloud engineers, and a lack of visibility into monitoring the status of mass workload migrations.

Enterprises want to benefit from the advantages of the public cloud, but without optimization they risk paying for services they don’t need, or not provisioning enough of the services they do need to support the availability and performance required for mission critical applications. Automation is the key to addressing these challenges, by enabling accelerated workload mobility and optimization at scale and completing “mass migrations” successfully in a matter of weeks, instead of up to 12 months.

“’Lift and Shift’ alone to the cloud has provided limited business value and control,” said Raj Dhingra, CloudVelox CEO. “When enterprises migrate brownfield applications to the cloud there can be dramatic inefficiencies if they are not optimized for the new environment. Now businesses can execute migrations with an unprecedented, automated ‘Lift and Optimize’ approach that ensures they receive the full benefits of the public cloud, whether that means reduced costs or improved performance. By matching the application environment in the datacenter to the optimal cloud compute and storage infrastructure whether based on cost or performance, and mapping data center network and security policies to cloud services — One Hybrid Cloud enhances management and control over applications without sacrificing cloud agility and accelerates the payback for even the most complex environments.”

In addition to automated workload migration to the cloud, CloudVelox is the industry’s first automation solution to combine workload mobility and workload optimization. CloudVelox approaches workload optimization in three phases of the cloud optimization lifecycle including pre-migration optimization — available now — and will build on the initial phase with additional features in the second continuous optimization phase and third fully optimized phase later this year:

  • Pre-migration optimization –leverages CloudVelox’s automated application blueprinting capabilities, matching the application’s data center infrastructure characteristics to the appropriate cloud compute, storage, network and security services prior to migrating the workloads to the cloud
  • Continuous Optimization (available summer 2017) — enables continuous optimization of migrated workloads by monitoring key areas such as instance, storage, availability and security policy to deliver actionable insights that can yield cost savings, better performance and availability as well as compliance with regulatory requirements
  • Fully Optimized (available summer 2017) — fully optimized approach further leverages cloud native services to deliver additional agility, cost savings and higher availability. For example, future features in the company’s cloud optimization roadmap include support for autoscale, RDS (MySQL and Oracle) and automated ELB across multiple instances

The One Hybrid Cloud 4.0 include new application-centric security groups, and application-centric placement groups along with comprehensive status reporting and alerts. Security groups can be assigned to a single system or a group of systems to control flow of traffic between and to apps in the cloud, and enable security policies to be mapped from the data center to the cloud to meet regulatory and compliance requirements. An app or a group of systems can be assigned to a placement group in a selected Amazon Web Services (AWS) region to enable performance optimization for applications requiring high performance compute, low latency and lots of network I/O. Automating the assignment of placement groups prior to migration also reduces IT effort in migrating and re-hosting these apps in the cloud.

New features to offer comprehensive reporting, alerts and enhanced management and control include:

  • An inventory of selected applications for replication with cloud characteristics such as CPU, RAM, instance type, storage type and other variables
  • An application launch report of currently replicating applications showing infrastructure services used by each app
  • Application launch status reports providing current status and time taken since launch and other information
  • A Sync report that lists the various systems that have synced and their consistency point.
  • System connect or disconnect alerts to proactively report on disconnected systems
  • Replication alerts indicating if a replication has started, not started or stopped
  • Application launch activity alerts indicating successful, failed, or suspended “launch” and “migration successful” alerts.

Application-centric instance tagging and IAM roles. Instance tagging allows single systems or a group of systems to be assigned tags to classify and categorize the migrated workloads. Tags can specify type of application, line of business, owner and up to 50 other categories that can be used for billing, reporting, utilization analysis and creating policies for cost and performance optimization

Source: CloudStrategyMag

Atomic Data Selects Corero’s Real-Time DDoS Mitigation Solution

Atomic Data Selects Corero’s Real-Time DDoS Mitigation Solution

Corero Network Security has announced that Atomic Data has selected the Corero SmartWall® Network Threat Defense (TDS) solution to protect its own network and its tenant networks from DDoS attacks.

Atomic Data provides data centers, hosting services, Atomic Cloud® technology and 24×7 managed IT service and support. “We were driven to seek out a DDoS mitigation solution due to the increasing severity and frequency of DDoS attacks against our hosted client base. DDoS attacks can create service interruptions for customers and create unpredictable work efforts for the engineers tasked with resolving them.” said Larry Patterson, chief technology officer and co-founder, Atomic Data.

Previously, Atomic Data used manual techniques for dealing with DDoS attacks.  After an attack was identified using network flow monitoring technology, upstream null routing required network engineers and architects to intervene. This approach resulted in slow and ineffective problem resolution for mitigating the attacks. Thus, Atomic Data felt compelled to find a DDoS solution that was not only more effective, but also more scalable and affordable.

Atomic Data selected the Corero SmartWall TDS as its dedicated real-time DDoS mitigation solution because it delivers a granular level of protection, and the product is flexible, affordable and scalable, with an easy-to-understand user interface. The Corero solution features attack dashboards for Atomic Data and their tenants. Atomic Data can assign subscriber/tenant service levels, and distribute reporting and analytics to tenants so they can see the value of the protection they are receiving.

“The key benefit of the Corero solution is that it automatically mitigates DDoS attack traffic, and surgically removes it at the network edge, before it can be impactful to our customers. We not only keep our networks clean of attack traffic, but our network engineering team now has more time to dedicate to servicing other customer needs and scaling our network to accommodate business growth,” added Patterson.

“One emerging trend is that enterprise customers are increasingly calling on their service providers to assist them in defeating DDoS attacks, and they are eager to adopt service-based DDoS mitigation from their native providers,” said Stephanie Weagle, vice president at Corero. “Hence, Corero’s real-time mitigation capabilities set Atomic Data apart from their competition when it comes to protection against damaging DDoS attacks, adds Weagle.”

 “Because we can offer DDoS protection as a standard service with all Atomic Cloud® instances, we now have a competitive advantage in the cloud marketplace,” said Patterson.

Source: CloudStrategyMag

5 web analytics tools every business needs

5 web analytics tools every business needs

Analytics tools have evolved considerably since the early days of the internet, when web developers had little more than hit counters to work with. And as the internet continues to evolve, analytics tools will continue to change, giving us greater insight into how our audience uses and interacts with our apps and websites.

It is true that there are a great many tools to choose from, but this is far from being a problem. All businesses and developers have different needs when it comes to analyzing behavior and performance, and it would be foolish for one tool to attempt to satisfy all needs. Instead of trying to find a nonexistent tool that does it all, you should be looking at a combination of analytics tools that will give you all the information you need.

Naturally, the cost of these tools will vary according to your needs. However, many robust analytics tools are quite affordable—including most in this roundup.

Google Analytics

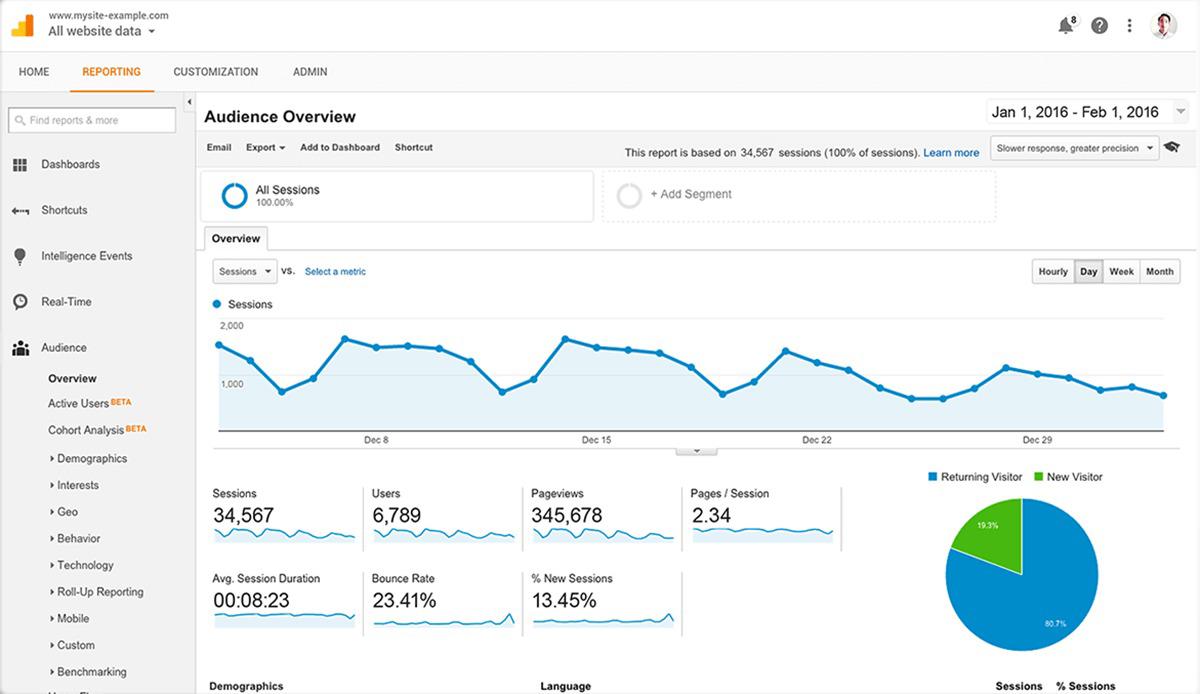
The grande dame of web analytics tools, Google Analytics is good for both casual and intricate analysis. As you might expect, Google Analytics integrates easily with other Google properties such as AdWords, Search Console, the Google Display Network, DoubleClick, and more recently, Firebase. Although the free version of Google Analytics has some limitations, it’s powerful enough to address the needs of small and medium-size businesses.

For basic reporting, Google Analytics works straight out of the box. You have access to analytics data within hours of adding a property—either a website or an app—and the relevant tracking code.

ian naylor google analyticsInfoWorld

But basic reporting is possibly a misnomer for the data Google Analytics generates without any customization. By default you have access to important metrics like bounce rates, geographic breakdown of traffic, traffic sources, devices used, behavior flows, top-performing pages and content, and more. These insights alone are enough to highlight what is working on your website and what you need to reassess.

Linking Google Analytics to the Search Console will bring in data specific to search traffic, including some keywords, and if you run AdWord campaigns, linking your AdWord account will reveal data relevant to your campaigns.

Almost every aspect of Google Analytics can be customized, from the Dashboard and Reports, through to Shortcuts and Custom Alerts. Custom Alerts are very much like the Check Engine light on car dashboards, with a text or email message sent to you whenever certain conditions are met. These could be anything from no recorded data on a specific day to significant increases or decreases in certain actions, including conversions, e-commerce, social media referrals, and ad performance.

More complex data is revealed once you set up goals relating to sales and conversions happening through your website. There are five types of goals you can set and measure, along with Smart Goals. If you have a path you expect users to follow toward conversion, a destination goal can be set up to measure each step through the funnel, so it’s possible for you to identify where you lose customers before conversion. Similarly, e-commerce conversions not only reveal which items are performing better than others, but also how long it takes a customer to decide to complete a purchase—measured in time and in sessions.

For app developers, the recent integration of Firebase into Google Analytics makes it possible to collect and view a wealth of data relating to your app. This isn’t limited to Android apps; iOS, C++, and Unity are also supported. As with Google Analytics, you get access to data and insights relating to user behavior, demographics, application crashes, push notification effectiveness, deep link performance, and in-app purchases.

Firebase offers many more features for app developers, but I’ve limited this discussion to highlighting only those that integrate with Google Analytics. Although I said there isn’t one tool that does it all, Google Analytics comes close to giving businesses all the insights they need, especially with the addition of Firebase for businesses that have already launched their own mobile apps.

Kissmetrics

Kissmetrics offers two products, Analyze and Engage, and while you might be most interested in Analyze, some of the insights it reveals could be addressed using Engage. Unlike Google Analytics, Kissmetrics is a premium product, with pricing from $220 per month, depending on the features and level of support you require.

What previously set Kissmetrics apart from Google Analytics was the fact that Google’s data was largely anonymous, while Kissmetrics tied every action on your website to a person, allowing you to track every aspect of a user’s journey. The introduction of User Explorer in Google Analytics changes this equation, but Kissmetrics is no less worth considering.

ian naylor kissmetricsInfoWorld

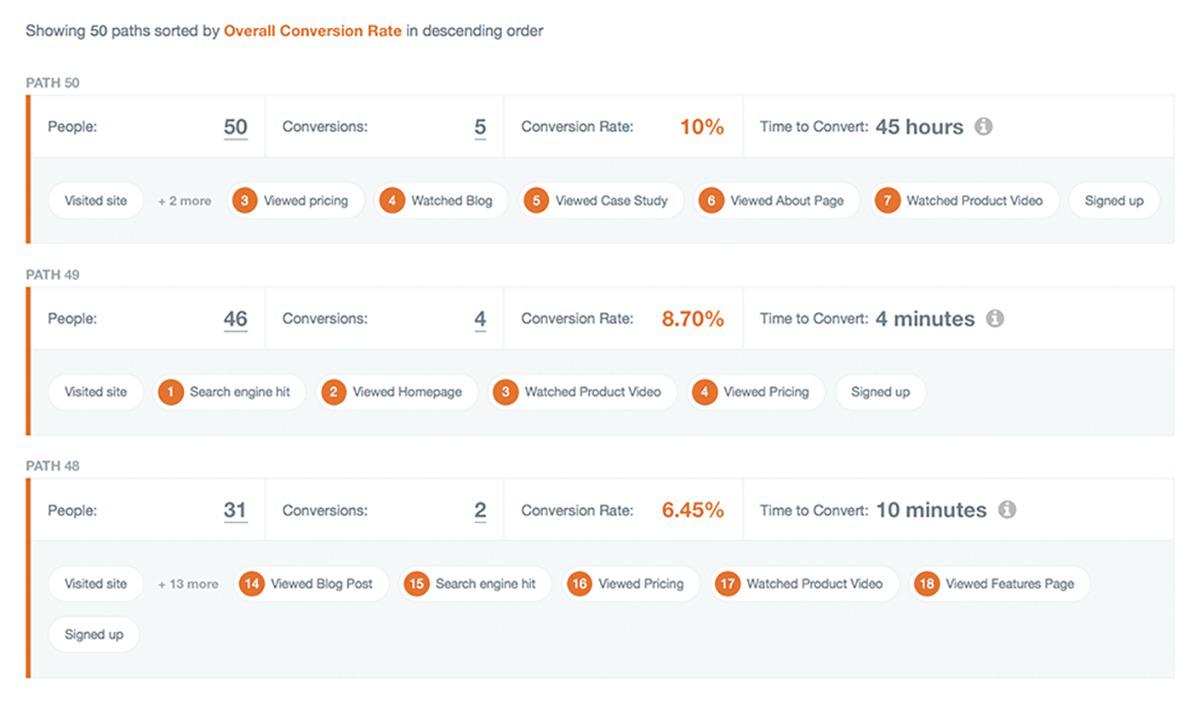
The basic version of Kissmetrics is focused on three items: Funnels, Paths, and People. With Funnels you are able to build acquisition and retention funnels, as well a refine them using multiple AND and OR conditions. Once you’ve set up your funnels, you can begin segmenting them using various attributes, allowing you to see how different groups move through your funnels and which groups are more likely to convert. Additionally you can see how individual funnels perform and generate lists of users who did not convert, allowing you to follow up with them to find out why.

The Path Report shows you the path visitors take to conversion. It shows the channel they arrived from (search engine query, directly typing the URL, and so on), then each action they took while on your site. This information is presented along with a conversion rate for each path and the time it took to convert. These insights make it easier for you to refine the paths and possibly increase your revenue.

Finally, the People Report allows you to find groups of people based on specific actions or details: whether they signed up or logged in, the device they used, and even how much they spent. These insights allow you to create custom campaigns for each group, while also allowing you to monitor for inactive customers, so you can intervene before losing them.

The more advanced Cohort, A/B Testing, and Revenue Reports are only available on higher plans, but are themselves valuable for any business offering SaaS or e-commerce products. The same applies to Engage, which allows you to choose which users you want to interact with and how. You do this by profiling customers according to how they arrived at your site (via direct access, search engine, social media post), then setting a trigger. There are three types of triggers: after a certain page loads, after the users scroll to a specific section of a page, or after a period of no user activity on a page. The trigger, in turn, activates the display of a notification or message, with appropriate call to action to guide the user into performing an action. It’s very similar to the email signup prompts you see on many sites, but made more powerful through the combination of segmentation and triggers.

Mixpanel

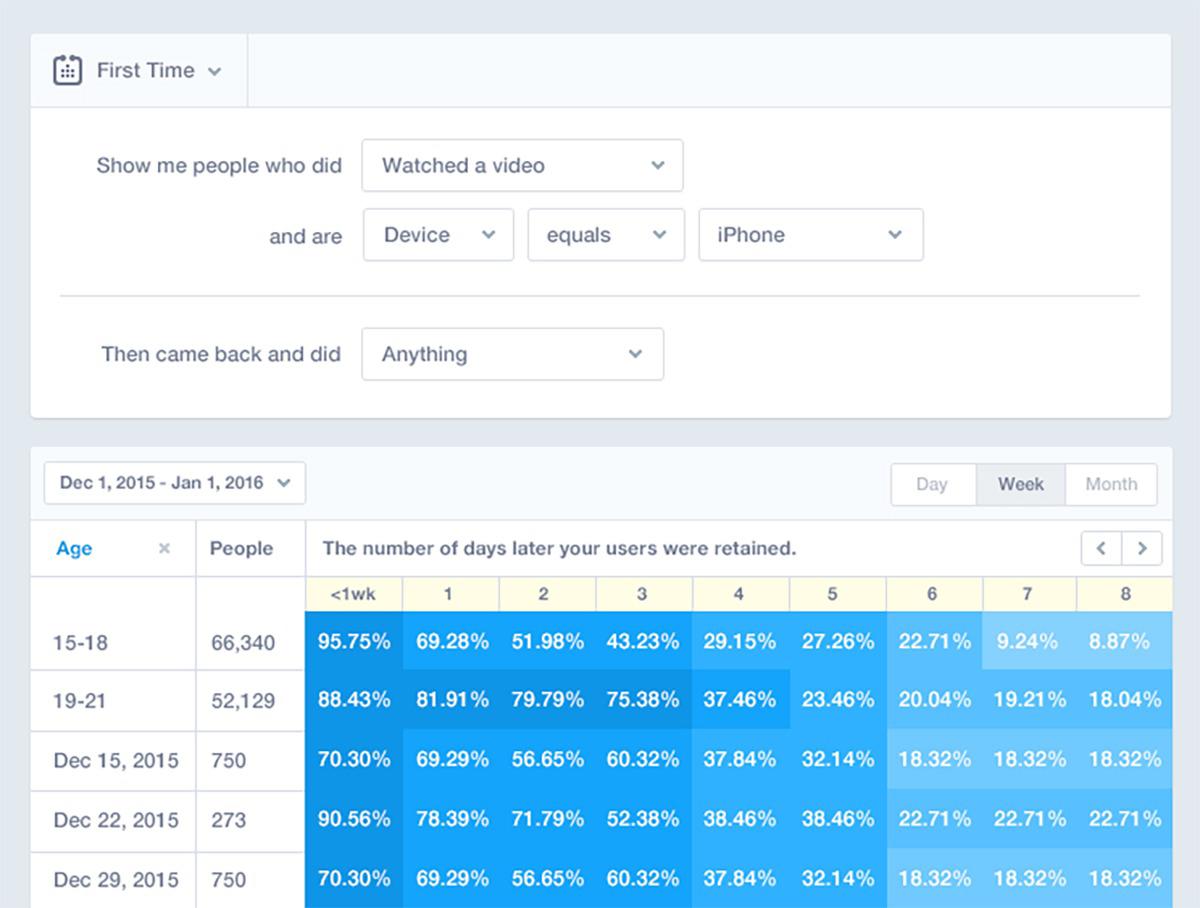
Like Segment and Google Analytics, Mixpanel allows you to track and analyze users across websites and apps, with a focus on tracking actions taken, rather than only views. Additionally, Mixpanel offers instant, real-time data analysis.

Mixpanel connects analysis to marketing. The analysis part looks at tracking, engagement, retention, and drop-offs, while marketing uses notifications (to users), A/B testing, and a customer profile database built using data from the analytics tool set.

ian naylor mixpanelInfoWorld

One feature that sets Mixpanel apart from other tools is retroactive analytics, meaning you can always re-analyze historical data using different metrics. This also means that any funnels you create aren’t final, so you can change the events tracked and see how this affects your historical analysis. As with Segment, all teams have access to data that is relevant to them, with the ability to analyze it according to their needs.

You can get started with Mixpanel in a matter of minutes, with live chat support if you get stuck. A free plan includes basic reporting across a 60-day history. Paid plans start at $99 per month, with Mixpanel acknowledging that some businesses have already set up mail and push notifications. Mixpanel includes notifications starting at $150 per month.

Localytics

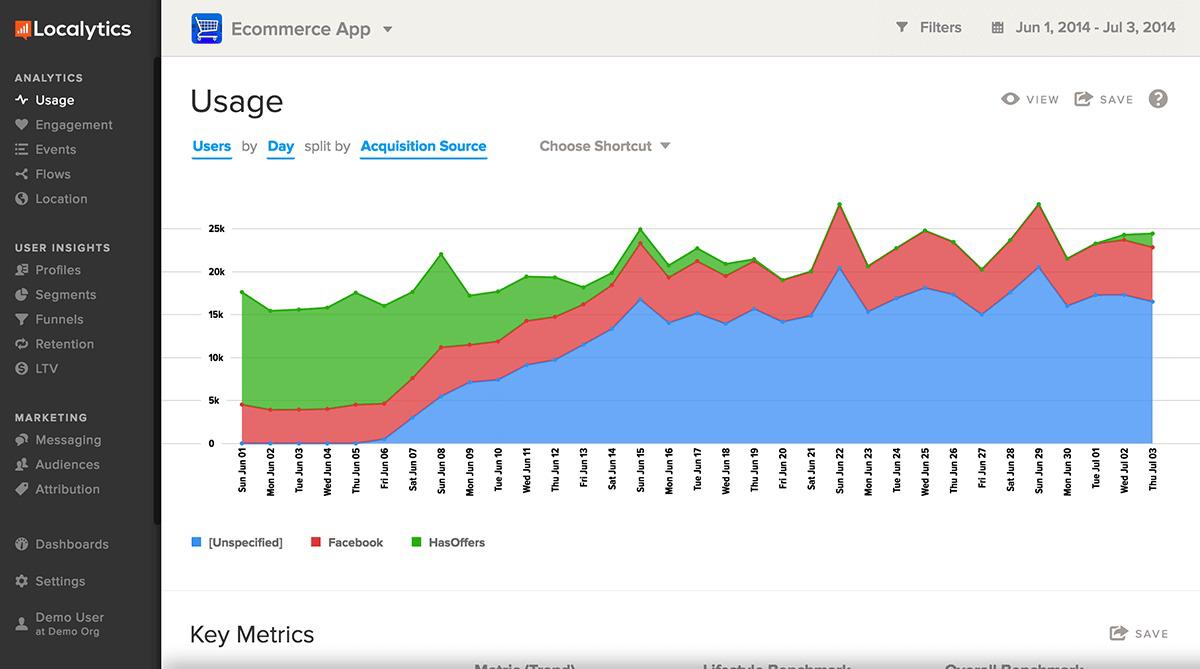
Whereas Google Analytics, Kissmetrics, and Mixpanel mainly focus on web analytics, with some ability to integrate app analytics, Localytics is all about mobile app analytics. Because sometimes you need a box cutter, not a Swiss Army knife.

Localytics is perfect for when you want better insights into how users are interacting with your app. It can tell you how frequently each user opens your app, how much time they spend using it, and what activities or content in the app attract the most attention.

ian naylor localyticsInfoWorld

Localytics not only allows you to see app activity, but highlights which users are most likely to churn or convert, based on predefined criteria. Localytics can create a profile database of all your users, making it easier to create segments based on identified interests and behavior and allowing you to execute highly targeted push notification campaigns.

Finally, because Localytics allows you to follow a user’s path through your app, you can create custom funnels to help you identify areas in the app that cause users to drop off, with the ability to be notified whenever someone uninstalls your app.

Localytics offers a variety of packages for everything from implementation to achieving specific outcomes such as retention, attribution, and remarketing. For pricing, you must contact the company.
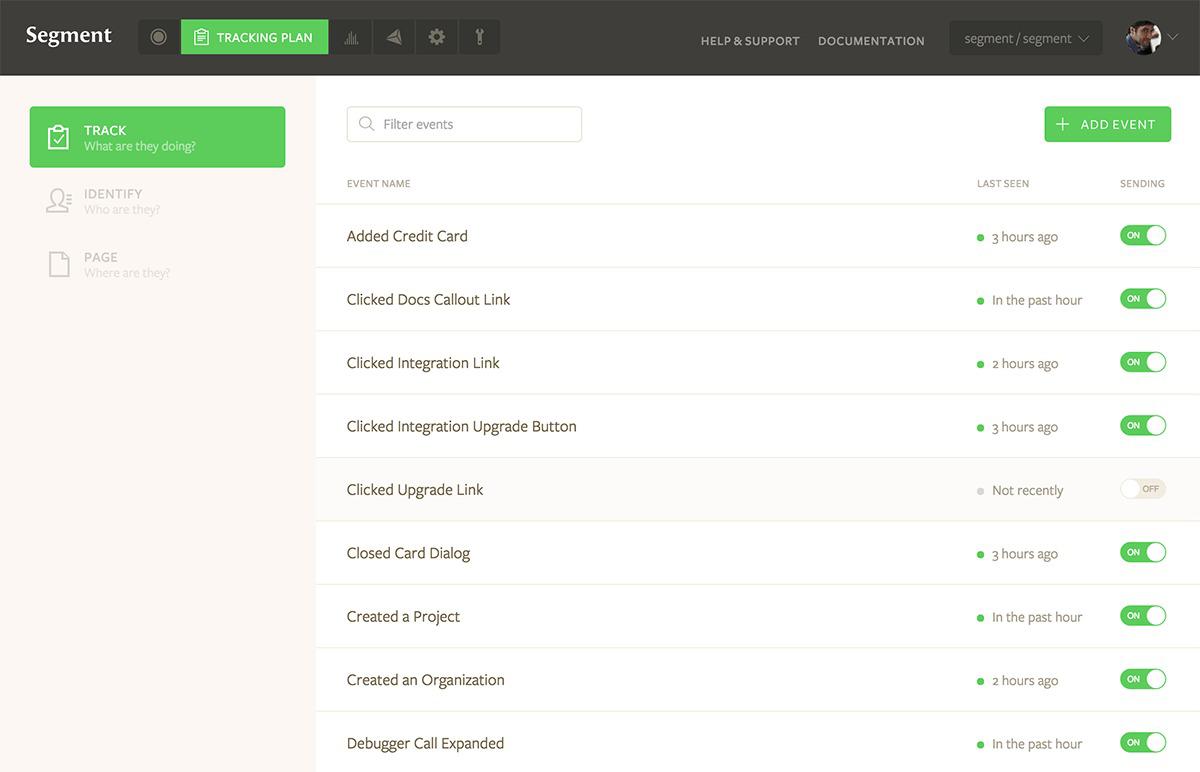
Segment

Segment differs from the other analytics tools discussed here in that it only collects, translates, and stores data. You can then integrate Segment with your preferred third-party tools, and the translated data is sent directly to these, ready for you to analyze further.

It might seem a bit counterintuitive to use an analytics tools that only collects data, but as Segment points out, it makes it easier to implement in your various properties, and for you to switch to using or trying other tools. For example, if you are currently using Google Analytics, but want to try Kissmetrics, without Segment you would first have to update code on all of your properties, repeating the whole process if you decide to go back to Google Analytics.

ian naylor segmentInfoWorld

Segment can collect raw data from most customer touchpoints, from apps and websites (including e-commerce platforms), through to servers and third-party cloud apps such as Salesforce, Stripe, and Drip. This is useful when you consider that your marketing department relies on a different set of analytics than your sales team and developers do. And you aren’t too limited by the number of tools you can send Segment data to, as Segment supports more than 100 tools.

The cost of Segment starts at $100 per month, excluding any third-party tools you send the data to, with a 14-day trial available. The biggest downside to Segment is that implementing it is a little more complex than most other analytics tools and depends on having your own data warehouse.

Each business will find value in a different set of tools, so it would be wrong of me to favor one over another. That said, for businesses with a limited budget, starting off with Segment makes a lot of sense. Segment integrates with Google Analytics and still makes it easy for you to try out other analytics tools later, as your budget allows.

At the same time, you would be wise to invest in some training on how to use your preferred analytics tools. While many are fairly easy to use, any extra knowledge you gain will only add more value to the insights you derive, so it’s easier to create actionable summaries that the rest of your team can implement. Analysis and insights mean nothing if they don’t generate actions that improve results.

New Tech Forum provides a venue to explore and discuss emerging enterprise technology in unprecedented depth and breadth. The selection is subjective, based on our pick of the technologies we believe to be important and of greatest interest to InfoWorld readers. InfoWorld does not accept marketing collateral for publication and reserves the right to edit all contributed content. Send all inquiries to newtechforum@infoworld.com.

Source: InfoWorld Big Data

IDG Contributor Network: Data governance as an accelerator, not a roadblock

IDG Contributor Network: Data governance as an accelerator, not a roadblock

Mention data governance to a developer and a chill might run up their spine.

Historically, data governance, the management of data access within an enterprise, has been seen as a time consuming, complex task with minimal long-term value to an organization. Yet along with the emerging role of the CDO (chief data officer), integrated and unified data governance is becoming a critical strategy for data-driven organizations.

Why does data governance matter?

Gone are the days of data governance applying only to highly regulated industries like healthcare, finance, and government. The amount of data available to organizations has skyrocketed in recent years, according to IDC the total amount of data worldwide will hit 180 zettabytes by 2025, and the chief data officer has become a critical member of any organization’s executive team.

 CDOs strive to succeed in five areas:

  • Creating enterprise-class data
  • Building data science assets
  • Developing an integrated cloud strategy
  • Attracting top talent
  • Achieving integrated and unified data governance

Data can be an organization’s biggest asset, but only if it is properly classified and in the hands of the right stakeholders. This is why data governance is so important to the CDO — it’s their job to ensure each stakeholder has the data they need to make better business decisions. By classifying data based on type, level of risk, etc., an organization can unleash the potential of its data in a safe and compliant manner.

The five step program for a unified data strategy

So how does one get started on a successful data governance strategy?

Step one, classify your data: In order to prevent legal ramifications that come with misrepresenting data, it is essential to properly classify all data within your organization. It can take up to six months to complete this process, but the end result is worth the time invested because identifying the risk associated with each piece of data is critical to compliance.

Step two, identify who has access to what data: Develop a data hierarchy within your organization so each employee has access to the data set they need to excel at their job. Determining this will depend on the employee’s role, department, level and other factors. For example, the finance team will need to have access to data on year over year company growth so they can plan budgets accordingly.

Step three, determine the policies associated with each piece of data: After determining who has access to what data, define the various policies associated with each data set. If data cannot be moved to another country due to differing data policies, be sure international employees do not have access.

Step four, catalogue and convert policies into code: Once data policies have been identified and employees assigned access to proper data sets, create a data policy catalogue and convert rules to code in order to automate processes. This will create a single data governance policy for your organization. Creation of a codified catalog of policies allows for the proactive application of data policies. All the previous steps were necessary to enable this. Applying policies proactively is required in order for governance to be an enabler. Policies should be allied as API’s whenever data is called for access or movement.

Step five, collaborate on data: Now that the unified data strategy has been solidified, different business units can collaborate to make better and more strategic decisions, resulting in significant business impact. Through open source tools within an organization, the teams can collaborate across data sets to better understand data and its value.

Taking the burden off developers

While developers may think achieving data governance is a roadblock for their teams, it actually lifts a weight off their shoulders. Without a data governance strategy, it is the responsibility of the development team to make sure the data is protected and in the hands of the appropriate decision makers.

With a data governance strategy, developers don’t need to worry about handing over data to the correct teams because the process is automated.

As all organizations become increasingly data-driven, a successful data governance strategy is not a roadblock, rather it accelerates productivity and streamlines data processes. Not only is data governance a benefit to organizations, but it is also a requirement as companies can be fined up to 4 percent of their revenue for not being up-to-code. Data governance is key to putting the power of data in every employee’s hands.

This article is published as part of the IDG Contributor Network. Want to Join?

Source: InfoWorld Big Data

SAP adds new features to Vora and readies a cloud version

SAP adds new features to Vora and readies a cloud version

SAP has added some new capabilities to SAP Vora, its in-memory distributed computing system based on Apache Spark and Hadoop.

Version 1.3 of Vora includes a number of new distributed, in-memory data-processing engines, including ones for time-series data, graph data and schema-less JSON data, that accelerate complex processing.

Common uses for the graph engine might be analyzing social graphs or supply chain graphs, said Ken Tsai, SAP’s head of product marketing for database and data management.

One application that would benefit from the new time-series engine is looking for patterns of electricity consumption in smart metering data.

“You can certainly do it without the time-series engine, but it’s not as efficient,” Tsai said.

SAP quietly released Vora 1.3 in late December, but chose to announce the new features Wednesday at Strata + Hadoop World 2017 in San Jose, Tsai said.

The product, previously known as SAP HANA Vora, has been renamed to avoid confusion with the company’s HANA in-memory computing platform, which is not needed in order to run it.

Vora is licensed in three editions: Standard and Enterprise, which are charged for per node, and Developer, which is free but cannot be used in production. The Enterprise edition additionally allows deep integration with HANA for companies that need it.

Although Vora can run on any Hadoop installation and integrate with cloud storage such as Amazon Web Services’ S3, SAP plans to offer a version hosted in its own cloud from early April, Tsai said.

Customers will be able to run it on SAP Cloud Platform Big Data Services (formerly known as Altiscale) in data centers in the U.S. and Germany.

Other new features include support for currency conversions and a range of free industry-specific add-ons such as a customer retention tool for telecommunications operators.

SAP unveiled the first version of Vora in September 2015, and by December last year had signed up 65 to 70 paying customers, Tsai said.

“One of the metrics we track internally is the conversion from free to paid, and we are seeing significant conversion compared to other products,” he said.

A small implementation of Vora would involve between three and 10 nodes, Tsai said.

“What’s been surprising to me is, for a lot of customers, this is already enough. They can deal with a lot of data with that,” he said.

Source: InfoWorld Big Data

Why Splunk keeps beating open source competitors

Why Splunk keeps beating open source competitors

All essential data infrastructure these days is open source. Or rather, nearly all — Splunk, the log analysis tool, remains stubbornly, happily proprietary. Despite a sea of competitors, the best of them open source, Splunk continues to generate mountains of cash.

The question is why. Why does Splunk exist given that “no dominant platform-level software infrastructure has emerged in the last 10 years in closed-source, proprietary form,” as Cloudera co-founder Mike Olson has said? True, Splunk was founded in 2003, 10 years before Olson’s declaration, but the real answer for Splunk’s continued relevance may come down to both product completeness and industry inertia.

Infrastructure vs. solution

To the question of why Splunk still exists in a world awash in open source alternatives, Rocana CEO Omer Trajman didn’t mince words in an interview: “We could ask the same question of the other dinosaurs that have open source alternatives: BMC, CA, Tivoli, Dynatrace. These companies continue to sell billions of dollars a year in software license and maintenance despite perfectly good alternative open source solutions in the market.”

The problem is that these “perfectly good open source solutions” aren’t — solutions, that is.

As Trajman went on to tell me, open source software tends to “come as a box of parts and not as a complete solution. Most of the dollars being spent on Splunk are from organizations that need a complete solution and don’t have the time or the talent to build a do-it-yourself alternative.”

Iguaz founder and CTO Yaron Haviv puts it this way: “Many [enterprises] also look for integrated/turn-key [solutions] vs DIY,” with open source considered the ultimate do-it-yourself alternative.

Sure, the “path to filling gaps” between Elasticsearch and Splunk may be “obvious,” Trajman continues, but “executing on it is less than trivial.” Nor is this the hardest problem to overcome.

An industry filled with friction

That problem is inertia. As Trajman told me, “Every company that runs Splunk [13,000 according to their latest earnings report], was once not running Splunk. It’s taken nearly 14 years for those massive IT ships to incorporate Splunk into their tool chest, and they still continue to run BMC, CA, Tivol and Dynatrace.” As such, “Even if the perfect out-of-the-box open source solution were to magically make its way onto every Splunk customer’s desks, they would still use Splunk, at least for some transitionary period.”

In other words, even if companies are embracing open source alternatives in droves, we’re still going to see healthy Spunk adoption.

It doesn’t hurt that Splunk, unlike its open source competitors, gets pulled into all sorts of jobs for which it offers a good enough, though not perfect, fit. According to Box engineer Jeff Weinstein, “misuse” is a primary driver of Splunk’s continued adoption, by which he means enterprises pushing data into Splunk for jobs it may not be particularly well-suited to manage. Splunk is flexible enough, he points out, that you “can abuse Splunk syntax to do anything and it kind [of] works on long historical time scale back data.” This means, Weinstein says, that “for many companies, [Splunk] is the ad hoc query system of last resort.” Open source options may abound, he notes, but don’t “give as much flexibility on query.”

Moreover, Splunk is “trusted,” Weinstein concludes, in an “old-school IBM style.” That is, not everyone may love it but at least “no one hates it.”

In short, while there are signs that open source alternatives like Elastic’s ELK will continue to progress, it’s unclear that any of these open offerings will seriously dent Splunk’s proprietary approach. Splunk simply offers too much in a world that prizes flexibility over an open license. This may not be the case five years from now, but for now Splunk stands supreme in a market that has otherwise gone wholesale for open source.

Source: InfoWorld Big Data