5 web analytics tools every business needs
Analytics tools have evolved considerably since the early days of the internet, when web developers had little more than hit counters to work with. And as the internet continues to evolve, analytics tools will continue to change, giving us greater insight into how our audience uses and interacts with our apps and websites.
It is true that there are a great many tools to choose from, but this is far from being a problem. All businesses and developers have different needs when it comes to analyzing behavior and performance, and it would be foolish for one tool to attempt to satisfy all needs. Instead of trying to find a nonexistent tool that does it all, you should be looking at a combination of analytics tools that will give you all the information you need.
Naturally, the cost of these tools will vary according to your needs. However, many robust analytics tools are quite affordable—including most in this roundup.
Google Analytics
The grande dame of web analytics tools, Google Analytics is good for both casual and intricate analysis. As you might expect, Google Analytics integrates easily with other Google properties such as AdWords, Search Console, the Google Display Network, DoubleClick, and more recently, Firebase. Although the free version of Google Analytics has some limitations, it’s powerful enough to address the needs of small and medium-size businesses.
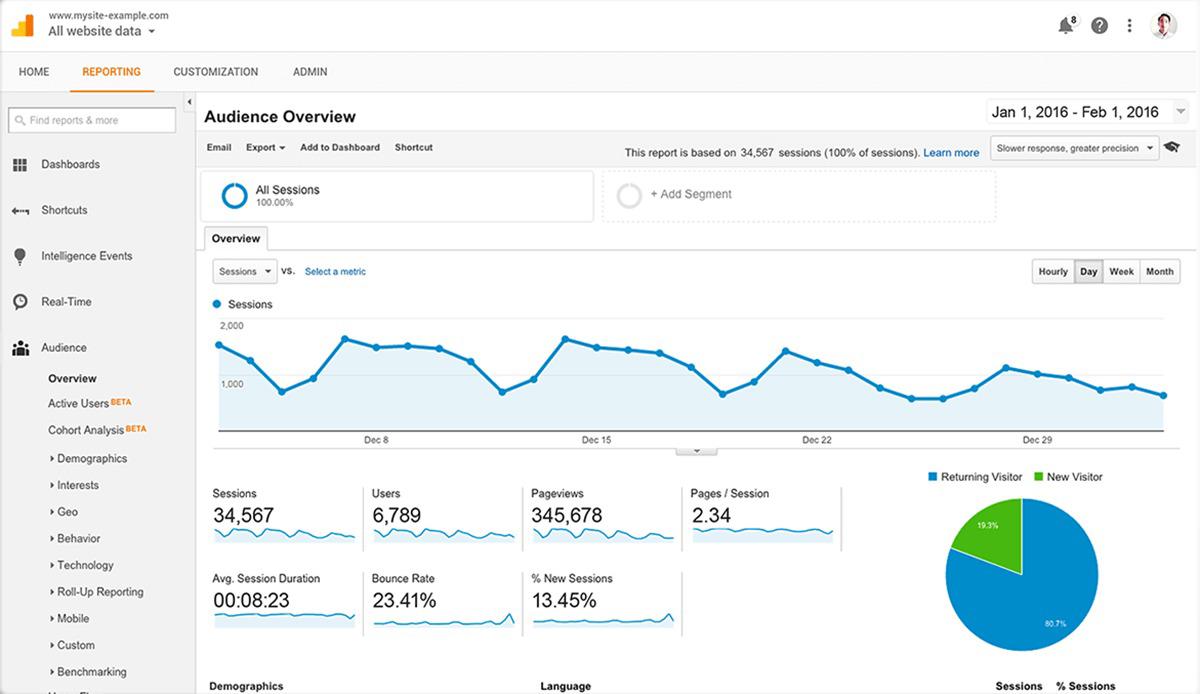
For basic reporting, Google Analytics works straight out of the box. You have access to analytics data within hours of adding a property—either a website or an app—and the relevant tracking code.
 InfoWorld
But basic reporting is possibly a misnomer for the data Google Analytics generates without any customization. By default you have access to important metrics like bounce rates, geographic breakdown of traffic, traffic sources, devices used, behavior flows, top-performing pages and content, and more. These insights alone are enough to highlight what is working on your website and what you need to reassess.
Linking Google Analytics to the Search Console will bring in data specific to search traffic, including some keywords, and if you run AdWord campaigns, linking your AdWord account will reveal data relevant to your campaigns.
Almost every aspect of Google Analytics can be customized, from the Dashboard and Reports, through to Shortcuts and Custom Alerts. Custom Alerts are very much like the Check Engine light on car dashboards, with a text or email message sent to you whenever certain conditions are met. These could be anything from no recorded data on a specific day to significant increases or decreases in certain actions, including conversions, e-commerce, social media referrals, and ad performance.
More complex data is revealed once you set up goals relating to sales and conversions happening through your website. There are five types of goals you can set and measure, along with Smart Goals. If you have a path you expect users to follow toward conversion, a destination goal can be set up to measure each step through the funnel, so it’s possible for you to identify where you lose customers before conversion. Similarly, e-commerce conversions not only reveal which items are performing better than others, but also how long it takes a customer to decide to complete a purchase—measured in time and in sessions.
For app developers, the recent integration of Firebase into Google Analytics makes it possible to collect and view a wealth of data relating to your app. This isn’t limited to Android apps; iOS, C++, and Unity are also supported. As with Google Analytics, you get access to data and insights relating to user behavior, demographics, application crashes, push notification effectiveness, deep link performance, and in-app purchases.
Firebase offers many more features for app developers, but I’ve limited this discussion to highlighting only those that integrate with Google Analytics. Although I said there isn’t one tool that does it all, Google Analytics comes close to giving businesses all the insights they need, especially with the addition of Firebase for businesses that have already launched their own mobile apps.
Kissmetrics
Kissmetrics offers two products, Analyze and Engage, and while you might be most interested in Analyze, some of the insights it reveals could be addressed using Engage. Unlike Google Analytics, Kissmetrics is a premium product, with pricing from $220 per month, depending on the features and level of support you require.
What previously set Kissmetrics apart from Google Analytics was the fact that Google’s data was largely anonymous, while Kissmetrics tied every action on your website to a person, allowing you to track every aspect of a user’s journey. The introduction of User Explorer in Google Analytics changes this equation, but Kissmetrics is no less worth considering.
 InfoWorld
The basic version of Kissmetrics is focused on three items: Funnels, Paths, and People. With Funnels you are able to build acquisition and retention funnels, as well a refine them using multiple AND and OR conditions. Once you’ve set up your funnels, you can begin segmenting them using various attributes, allowing you to see how different groups move through your funnels and which groups are more likely to convert. Additionally you can see how individual funnels perform and generate lists of users who did not convert, allowing you to follow up with them to find out why.
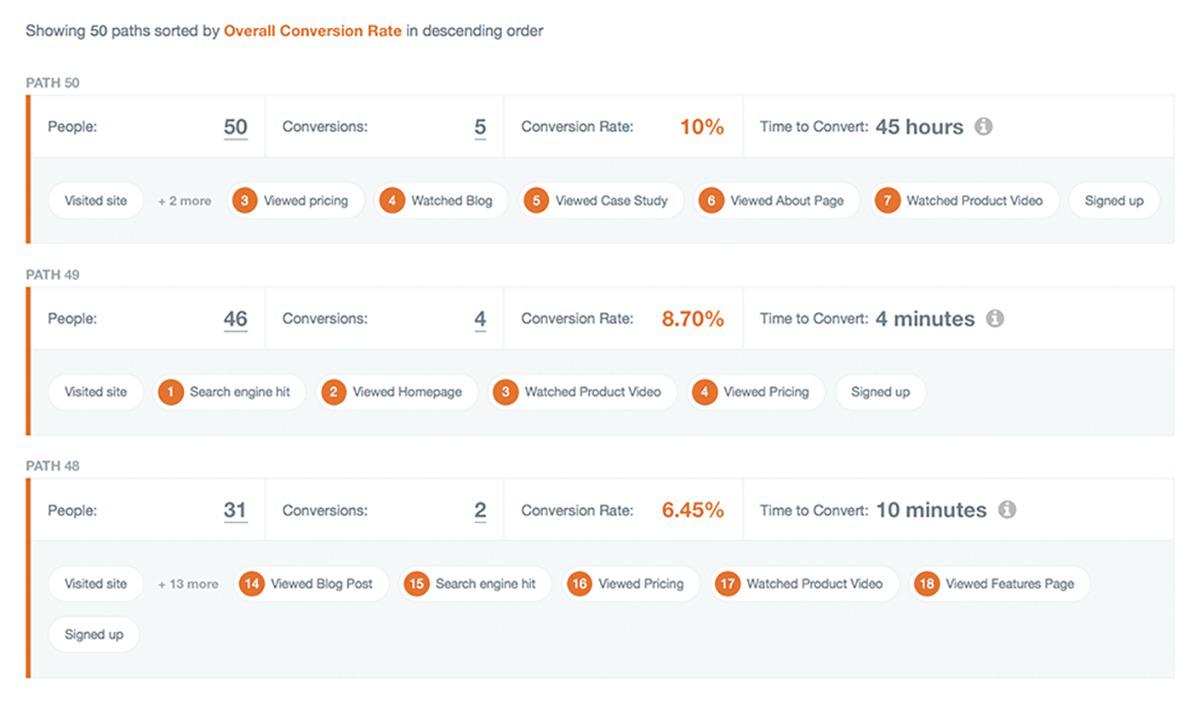
The Path Report shows you the path visitors take to conversion. It shows the channel they arrived from (search engine query, directly typing the URL, and so on), then each action they took while on your site. This information is presented along with a conversion rate for each path and the time it took to convert. These insights make it easier for you to refine the paths and possibly increase your revenue.
Finally, the People Report allows you to find groups of people based on specific actions or details: whether they signed up or logged in, the device they used, and even how much they spent. These insights allow you to create custom campaigns for each group, while also allowing you to monitor for inactive customers, so you can intervene before losing them.
The more advanced Cohort, A/B Testing, and Revenue Reports are only available on higher plans, but are themselves valuable for any business offering SaaS or e-commerce products. The same applies to Engage, which allows you to choose which users you want to interact with and how. You do this by profiling customers according to how they arrived at your site (via direct access, search engine, social media post), then setting a trigger. There are three types of triggers: after a certain page loads, after the users scroll to a specific section of a page, or after a period of no user activity on a page. The trigger, in turn, activates the display of a notification or message, with appropriate call to action to guide the user into performing an action. It’s very similar to the email signup prompts you see on many sites, but made more powerful through the combination of segmentation and triggers.
Mixpanel
Like Segment and Google Analytics, Mixpanel allows you to track and analyze users across websites and apps, with a focus on tracking actions taken, rather than only views. Additionally, Mixpanel offers instant, real-time data analysis.
Mixpanel connects analysis to marketing. The analysis part looks at tracking, engagement, retention, and drop-offs, while marketing uses notifications (to users), A/B testing, and a customer profile database built using data from the analytics tool set.
 InfoWorld
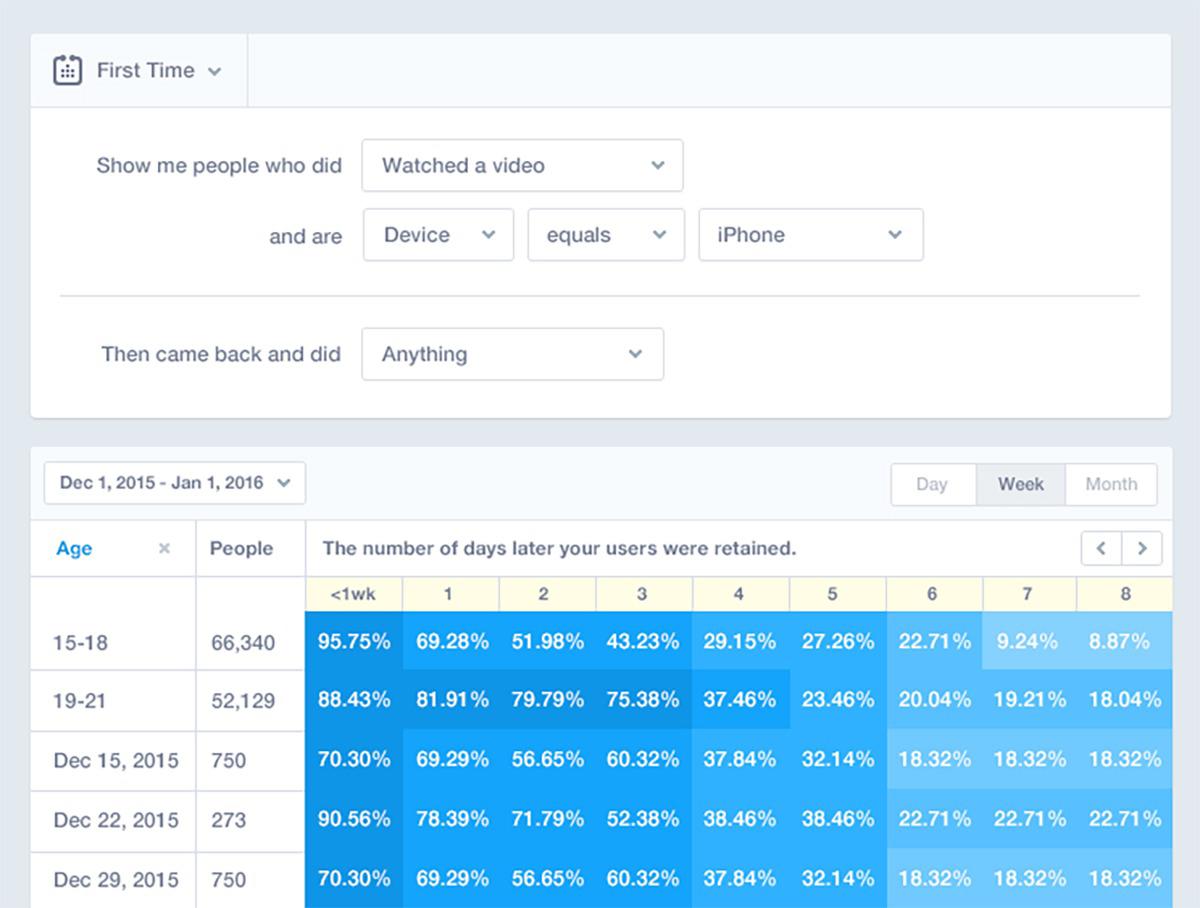
One feature that sets Mixpanel apart from other tools is retroactive analytics, meaning you can always re-analyze historical data using different metrics. This also means that any funnels you create aren’t final, so you can change the events tracked and see how this affects your historical analysis. As with Segment, all teams have access to data that is relevant to them, with the ability to analyze it according to their needs.
You can get started with Mixpanel in a matter of minutes, with live chat support if you get stuck. A free plan includes basic reporting across a 60-day history. Paid plans start at $99 per month, with Mixpanel acknowledging that some businesses have already set up mail and push notifications. Mixpanel includes notifications starting at $150 per month.
Localytics
Whereas Google Analytics, Kissmetrics, and Mixpanel mainly focus on web analytics, with some ability to integrate app analytics, Localytics is all about mobile app analytics. Because sometimes you need a box cutter, not a Swiss Army knife.
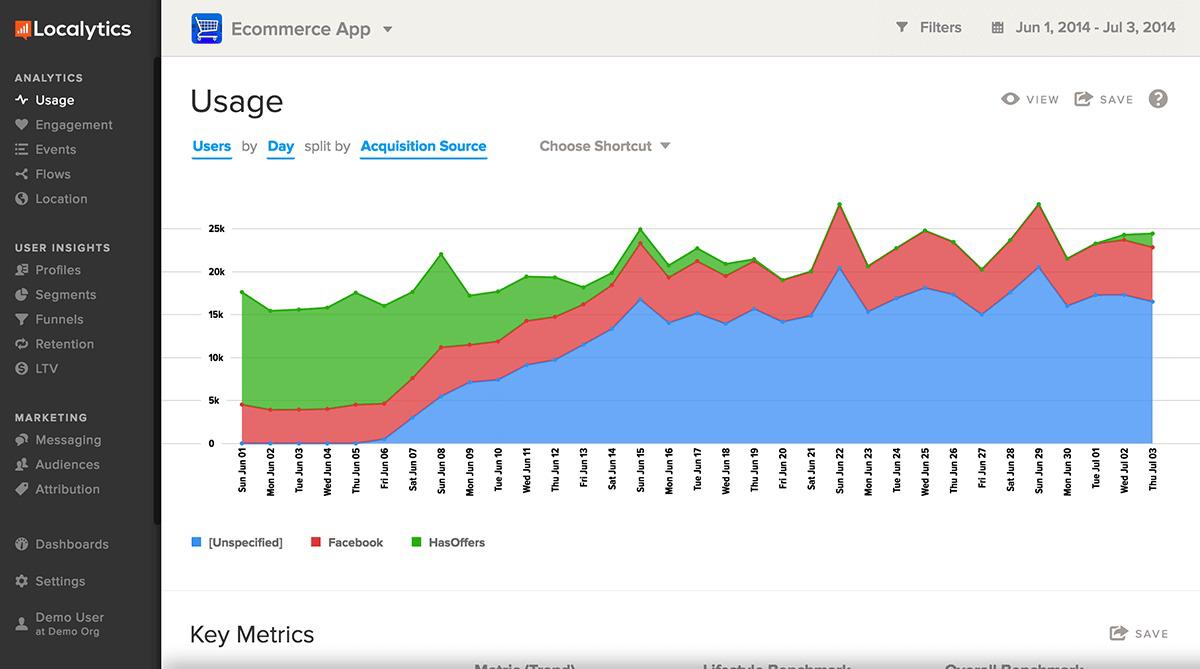
Localytics is perfect for when you want better insights into how users are interacting with your app. It can tell you how frequently each user opens your app, how much time they spend using it, and what activities or content in the app attract the most attention.
 InfoWorld
Localytics not only allows you to see app activity, but highlights which users are most likely to churn or convert, based on predefined criteria. Localytics can create a profile database of all your users, making it easier to create segments based on identified interests and behavior and allowing you to execute highly targeted push notification campaigns.
Finally, because Localytics allows you to follow a user’s path through your app, you can create custom funnels to help you identify areas in the app that cause users to drop off, with the ability to be notified whenever someone uninstalls your app.
Localytics offers a variety of packages for everything from implementation to achieving specific outcomes such as retention, attribution, and remarketing. For pricing, you must contact the company.
Segment
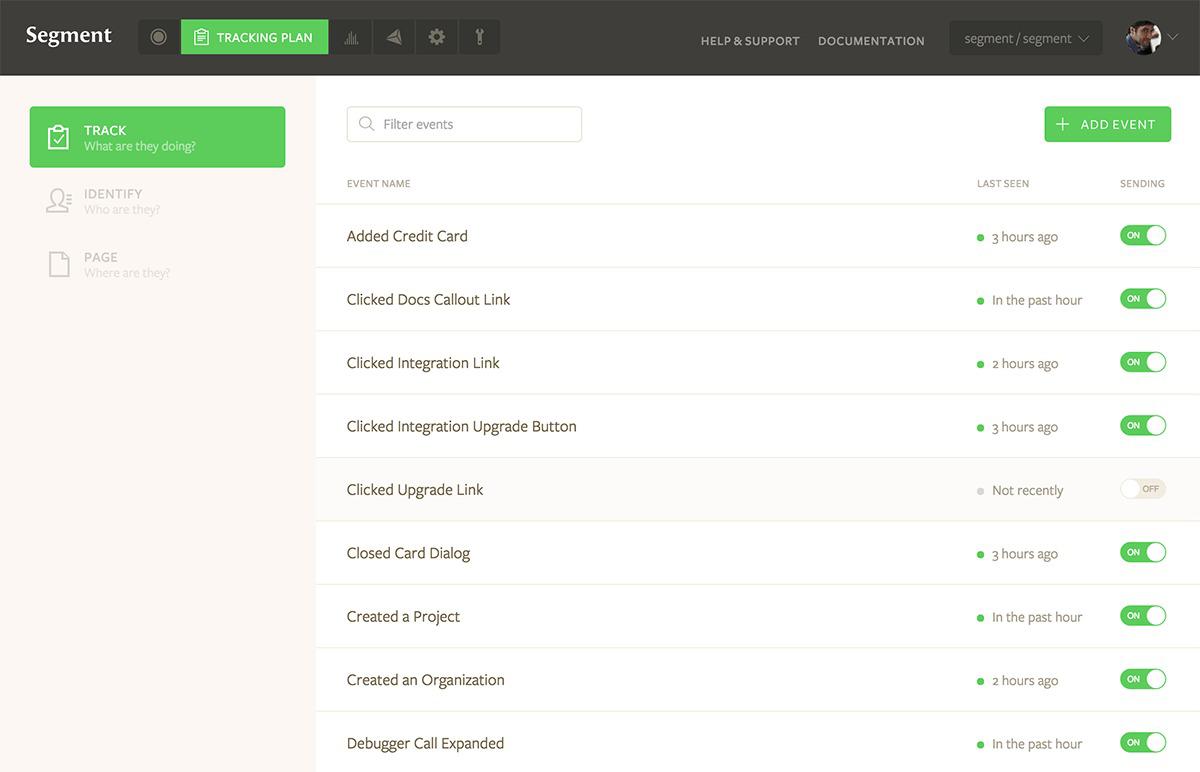
Segment differs from the other analytics tools discussed here in that it only collects, translates, and stores data. You can then integrate Segment with your preferred third-party tools, and the translated data is sent directly to these, ready for you to analyze further.
It might seem a bit counterintuitive to use an analytics tools that only collects data, but as Segment points out, it makes it easier to implement in your various properties, and for you to switch to using or trying other tools. For example, if you are currently using Google Analytics, but want to try Kissmetrics, without Segment you would first have to update code on all of your properties, repeating the whole process if you decide to go back to Google Analytics.
 InfoWorld
Segment can collect raw data from most customer touchpoints, from apps and websites (including e-commerce platforms), through to servers and third-party cloud apps such as Salesforce, Stripe, and Drip. This is useful when you consider that your marketing department relies on a different set of analytics than your sales team and developers do. And you aren’t too limited by the number of tools you can send Segment data to, as Segment supports more than 100 tools.
The cost of Segment starts at $100 per month, excluding any third-party tools you send the data to, with a 14-day trial available. The biggest downside to Segment is that implementing it is a little more complex than most other analytics tools and depends on having your own data warehouse.
Each business will find value in a different set of tools, so it would be wrong of me to favor one over another. That said, for businesses with a limited budget, starting off with Segment makes a lot of sense. Segment integrates with Google Analytics and still makes it easy for you to try out other analytics tools later, as your budget allows.
At the same time, you would be wise to invest in some training on how to use your preferred analytics tools. While many are fairly easy to use, any extra knowledge you gain will only add more value to the insights you derive, so it’s easier to create actionable summaries that the rest of your team can implement. Analysis and insights mean nothing if they don’t generate actions that improve results.
New Tech Forum provides a venue to explore and discuss emerging enterprise technology in unprecedented depth and breadth. The selection is subjective, based on our pick of the technologies we believe to be important and of greatest interest to InfoWorld readers. InfoWorld does not accept marketing collateral for publication and reserves the right to edit all contributed content. Send all inquiries to newtechforum@infoworld.com.
Source: InfoWorld Big Data

